

Unlike other finales in movie franchises that turn out to only be a part 1 with the part 2 being another 1-2 years away, this part 2 of my finale follows hot on the heels of the part 1.
Not following what I’m referring to? Then read part 1 before continuing.
.
.
.
.
.
Now that you’re all caught up…
Solution Overview
The “M365 Copilot Usage Reporter” solution I’ve created is made up of several components:
- Entra ID app registration to interact with Microsoft Graph
- Power Automate workflows to capture Copilot interactions for licensed users
- Dataverse tables to store the data
- Power BI report to display the data
Let’s break these down individually.
Entra ID app registration
We need to create an app registration with the following application-level permissions:
- AiEnterpriseInteraction.Read.All – this will do the actual reading of the Copilot interactions
- Directory.Read.All – this is used to read users and various properties about them, licenses, etc. (It might be possible to use a lower-level API permission, but I didn’t try.)
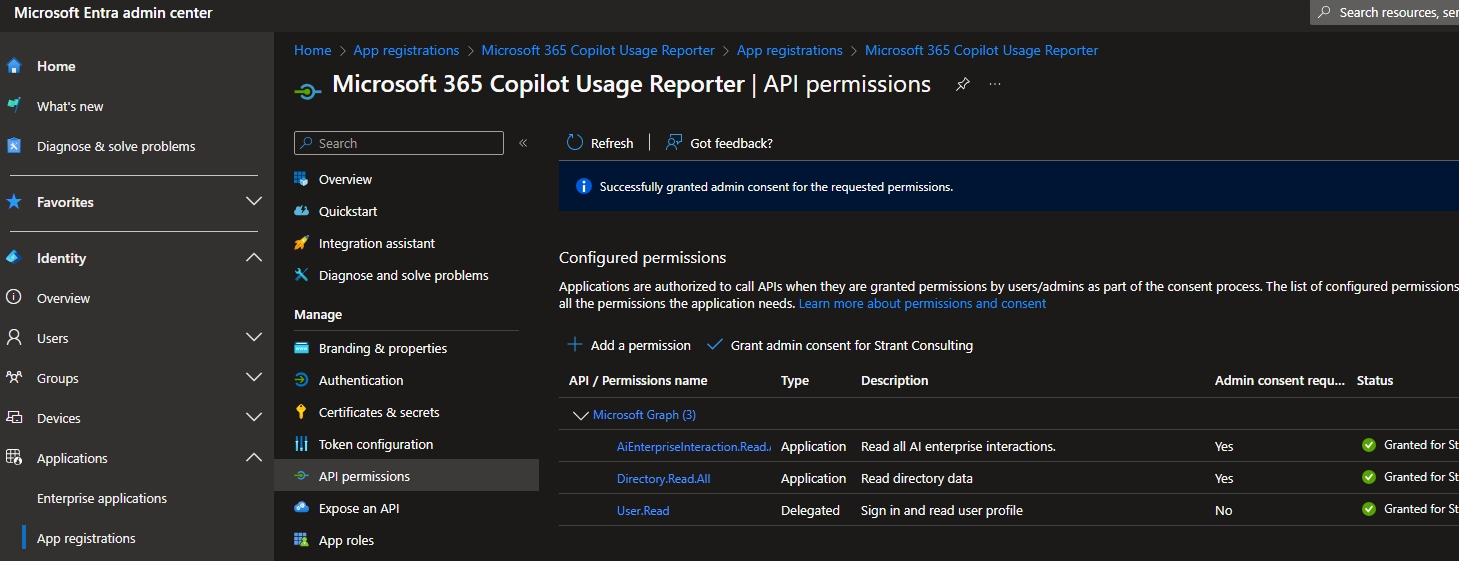
You’ll need to create a secret as well. Store this, the client/application ID, and your tenant ID for the next step.
Workflows & tables
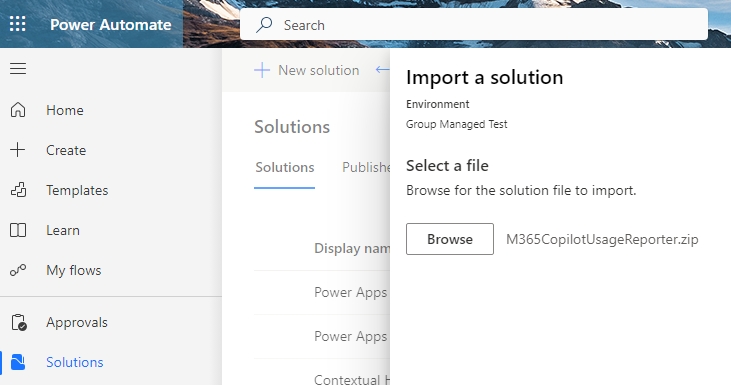
Head over to https://make.powerautomate.com and import the Power Platform solution file you downloaded from my GitHub repository.
NOTE: The account that will run the workflows will need the Power Automate Premium license, due to the usage of Dataverse tables.
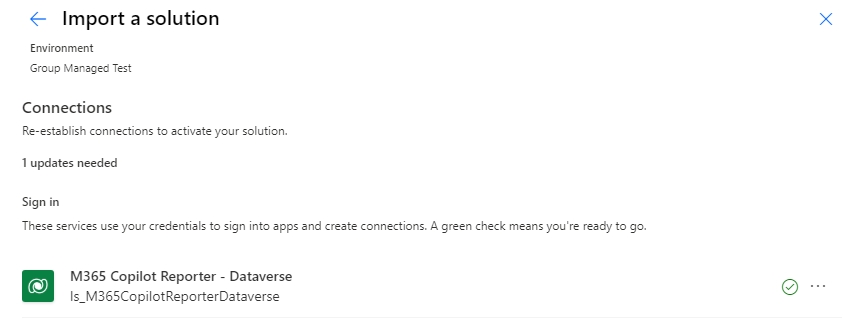
After the confirmation screen, it should then automatically create a Dataverse connection for you (if one doesn’t already exist).
After this point, you’ll be prompted to enter your tenant ID, application ID, and secret value.
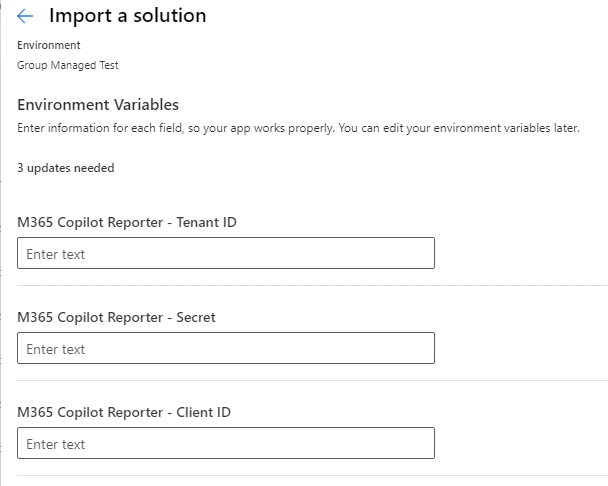
Once you’ve put those in and continued, the import will begin and should only take a few minutes.

While we wait for it to install, why don’t we find out…
What’s in the box?

A good question. What’s in this solution, and how does it work?
Inside, you’ll find a mixture of tables, connections references, and workflows
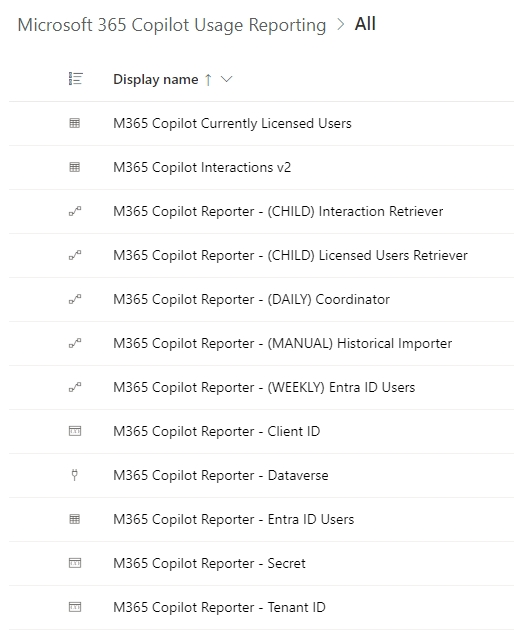
First, let’s address the 3 tables:
- M365 Copilot Currently Licensed Users: this table stores (you guessed it) all the users in your environment that are licensed for M365 Copilot. The contents of the table are wiped and re-created every day, as the listing will change.
- M365 Copilot Interactions v2: this table stores (you guessed it) all of the actual Copilot interactions by users. The table is not wiped and will continue to grow every day as more records are added.
Why is it called “v2”? Because there was a previous version of it in this solution, I needed a new table, called it “v2”, and deleted the old one. Are you happy that I’ve aired my dirty laundry now??? - M365 Copilot Reporter – Entra ID Users: this table stores (you (hopefully) guessed it) all of the licensed users in your tenant. This is used to provide a comparison of who is and isn’t licensed for M365 Copilot, as well as additional user details about those who are.
Now, let’s focus on the 5 workflows, as that’s where all the work…. flows.
- M365 Copilot Reporter – (DAILY) Coordinator: this workflow runs daily at UTC midnight and calls the two child workflows:
- M365 Copilot Reporter – (CHILD) Licensed Users Retriever: this workflow empties out the table with the M365 Copilot licensed users and retrieves a fresh listing.
- M365 Copilot Reporter – (CHILD) Interaction Retriever: this performs the API call against Microsoft Graph to retrieve the Copilot interactions.
This workflow doesn’t just get the interactions, it is removes some of the fields from being recorded for two reasons:- Results in Copilot responses are not recorded due to privacy reasons
- Some of the outputs are images, which result in blocks of text that are too big to store in a table row
- M365 Copilot Reporter – (WEEKLY) Entra ID users: this workflow performs a weekly extraction of all licensed users in your Microsoft 365 tenant. Unfortunately this means it may pick up things like service accounts, Teams meeting rooms, and other non-human accounts. The workflow runs once a week and is independent of the others.
- M365 Copilot Reporter – (MANUAL) Historical Importer: this workflow only exists to be run after you’ve performed the installation, and the Coordinator workflow has completed its first run.
Because the daily workflow only collects interactions for the previous day, (I hope) you will want to get any other Copilot interactions that have been performed before you’ve installed this solution.
The Historical Importer uses the Interaction Retriever child workflow in the same way the Coordinator does, but it provides the API call with a different date range to work from: everything between 365 days and the previous day. This effectively avoids any potential overlap between the two workflows being run.
I would strongly suggest you run it straight away and then delete it as it no longer serves a purpose.
NOTE: The Historical Importer will take longer to run than the Coordinator does, due to the volume of data it needs to retrieve. In a small deployment (88 users) this did not cause any issues, however in a larger deployment (950 users) I did see some child workflows running long and eventually timing out – so please keep an eye on this.
Even without the Historical Importer workflow completing, you’re now ready to move onto the Power BI report installation.
Power BI report
Locating the Power BI template file you downloaded from my GitHub repository, simply open the file to start connecting to the Dataverse tables.
You’ll first be prompted for the host address of the Power Platform environment where the solution was imported to.

The easiest way to achieve this is to browse to https://make.powerapps.com (this doesn’t work from Power Automate, only from the Power Apps portal) and select the environment where you installed the solution. In the top-right corner, click the gear icon and select session details:

You’ll then see a bunch of GUIDs and other things, but this is what we’re after:

Take note that we don’t want any of the characters before or after the host address, just the “orgxxxxx.crmx.dynamics.com” part that I’ve highlighted in the screenshot.
Paste that into the prompt in Power BI and press the Load button. You’ll then be asked to sign in, so that the connection to the environment can be made.

Follow the prompts and then press the Connect button.
This next step will take a bit of time while it retrieves all the data in the table (longer if you’ve run the Historical Importer).
When all is done, your data will be there!

From here, all you need to do is publish the report somewhere and make it available to those who need it!
Conclusion
It is important to remember that the endpoint we’re using to pull the data here is in beta, and therefore subject to change. If I see something change significantly, I’ll try to update the solution.
Also, throughout the 6 weeks that I’ve been working on this solution I have seen changes to the data around the apps that show up as “M365App”, “BizChat”, and “WebChat”. It’s not entirely clear what they’re supposed to be / how they differ, and while some assumptions are made, I will most likely post an updated version of the template when it’s clearer.
If you have suggestions on how to improve the Power BI report such as other visuals, scores, or other things, please don’t just leave a comment – share your modifications so everyone can benefit!
Also published on Medium.
Discover more from Loryan Strant, Microsoft 365 MVP
Subscribe to get the latest posts sent to your email.
Hi thanks for the great work, I have an error with this: flow M365 Copilot Reporter – (WEEKLY) Entra ID Users “Flow client error returned with status code “BadRequest” and details “{“error”:{“code”:”InvalidOpenApiFlow”,”message”:”Flow save failed with code ‘InvalidPaginationPolicy’ and message ‘The pagination policy of workflow run action ‘HTTP_-_Get_items_from_API’ of type ‘Http’ at line ‘1’ and column ‘2109’ is not valid. The value specified for property ‘minimumItemsCount’ exceeds the maximum allowed. Actual: ‘100000’. Maximum: ‘5000’.’.”}}”. ” Can you help me on this ? Thanks
Ah, whoops!
The issue is because I had set the pagination of the get user HTTP action to be 100k, but that only works if you have a Power Automate premium license (which you need for Dataverse access anyway).
If you lower it to 5000 in the settings of that action, it’ll work. But, not sure if any other part of it will if you don’t have the license.
May I know what this means? I got this after import solution. Btw great work on this. Very useful
Solution “Microsoft 365 Copilot Usage Reporting” imported successfully with warnings: Flow client error returned with status code “Forbidden” and details “{“error”:{“code”:”MissingAdequateQuotaPolicy”,”message”:”Flow could not be activated because you need a [Power Automate Premium license](https://go.microsoft.com/fwlink/?linkid=2297915) or other license that includes premium connectors to save this flow with connection: ‘Microsoft Dataverse'”,”extendedData”:{}}}”.
Ah yes, sorry, I forgot to add that as a requirement.
Because the workflow uses Dataverse tables it needs to run under an account with a Power Automate Premium license. Will update the blog post now.
Thank you so much! Loading the PowerApps solution in PowerBi it shows me blank report. How usually will take effect to see the report? Is there anything I need to run in PowerApps side?
Have you checked if the workflows inside the solution worked successfully?
Thanks, Loryan! The report is now working. By the way, I have a few clarifications. On the Home tab, there’s “Number of users using the app” and another tab named as “Usage by app.” What’s the difference between the two? I noticed the numbers don’t match.
Hey Jodie, that’s fantastic news, glad you got it working!
The difference between them is that the front screen shows the total number of users that use each app, vs. the “Usage by app” shows the total amount of interactions per app.
What would probably make a better interface, would be to show both values on the graph so it shows the number of users inside the bar for the number of interactions.
The other thing I’d thought of, but hadn’t done was to create things like averages per app, or other metrics. At the end of the day, there’s only so much BI I can do. 🙂
Hi Loryan, thank you so much for your great work, it has been really helpful so far. If you don’t mind, could you clarify the difference between “Usage by User” and “Interaction Count by User (Last 30 days)”? Some of the numbers don’t seem to match, and I wanted to clarify this before making any assumptions.
Thanks again in advance!
Glad to hear it Con!
Do you mean the “Interaction Count by Category” screen? That’s not per user, and is more so just grouping the data so you can see a broader view of how many interactions all users are doing.
So, what is the program exactly counting as an interaction? Just opening the app? editing a file? making a prompt?
Thanks for your fast reply Loryan
If you have a look at the prior blog post I have a link to the data source where the interactions come from.
Now, that data provides both prompt and response – I only count the prompt data.
Further to that, I filter it down to be individual sessions.
So, where you might have a long flowing conversation with Copilot in Word with 20 prompts and responses being a total of 40 interactions – I count that as 1, as it’s a single session.
Otherwise if I counted every prompt and response as an interaction, the data would be wildly different and I don’t think a very accurate representation.
Great & very useful solution, thanks for sharing. When I import I get this message, what does it mean & what are next steps?
Solution “Microsoft 365 Copilot Usage Reporting” imported successfully with warnings: Flow client error returned with status code “BadRequest” and details “{“error”:{“code”:”ChildFlowNeverPublished”,”message”:”The workflow with id ‘xxxxx’ cannot be used as a child workflow because it has never been published. Child workflows need to be published at least once before they can be included in a published parent workflow.”}}”.
..submitting the message again:
Solution “Microsoft 365 Copilot Usage Reporting” imported successfully with warnings: Flow client error returned with status code “BadRequest” and details “{“error”:{“code”:”ChildFlowNeverPublished”,”message”:”The workflow with id ‘0cd572be-53ce-ef11-8ee9-000d3a79c13a’ cannot be used as a child workflow because it has never been published. Child workflows need to be published at least once before they can be included in a published parent workflow.”}}”.
Check each of the workflows with “CHILD” in the name.
If you go into the workflow it’s probably showing as draft.
Hit Publish and it should be fine.
thanks Loryan, that worked. On installing/importing the solution, all flows were in ‘off’ state & simply turning them ‘On’, then publishing the solution was fine. I’m in an educational organization and realized wasn’t getting any licensed users even though we have ~40. I found that the SkuId should match what your org has purchased. We have the “Microsoft_365_Copilot_EDU” and not “Microsoft_365_Copilot” & these SkuId’s are listed on https://learn.microsoft.com/en-us/entra/identity/users/licensing-service-plan-reference.
Replacing the correct SkuId in the HTTP action of the “M365 Copilot Reporter – (CHILD) Licensed Users Retriever” flow will get you all the users.
Good pickup on that one. I hadn’t tested it on an EDU tenant so wasn’t aware it was a different SKU ID.
Thanks!
Hi Loryan, thank you for this useful tool. Unfortunately I get this error when I try to import it. Can you offer any suggestions as to why? I’ve already ensured that the app permissions have been granted, and I’m importing this as a user who has a premium power automate licence and therefore dataverse access.
Solution “Microsoft 365 Copilot Usage Reporting” failed to import: SecLib::CheckPrivilege failed. User: 380e7439-7e2b-ee11-bdf4-000d3ad0f9a3, PrivilegeName: prvCreateEntity, PrivilegeId: 341e3ebf-74b8-4335-84f3-7f617bb7d081, Required Depth: Basic, BusinessUnitId: 60482048-7b42-e911-a97e-000d3ad1caf6, MetadataCache Privileges Count: 5664, User Privileges Count: 1626
thanks!
I found I needed to go into Power Platform Admin and environment adding the solution to and grant the account system administrator role
That’s a good pickup, I’d only done it as the owner of the Power Platform environment – so hadn’t considered what roles someone might need.
I’ll make sure to include that in any future documentation.
I also tried importing your copilot trial management solution and it worked, so it isn’t that I don’t have permission to properly import solutions.
Hey Stephen, thank you for trying to troubleshoot this by importing another solution as a test – that helped as you’ve ruled out one of the permissions.
And you’ve got the right license – so that rules out another issue.
However, it does still look like it’s a permission/roles issue. As the Copilot trial management solution uses Lists, it wouldn’t be doing anything with Dataverse – but the fact that we’re seeing “prvCreateEntity” in the error tells me it’s something to do with Dataverse tables, and possibly not having the ability to create them. Can please you double-check that you have the role applied to your account that enables you to create tables?
Thanks Loryan,
Strangely we added power platform administrator rights which should give it full rights to create dataverse tables. However we still got the same error so something more appears to be needed to allow it to work.
We resolved this by using a global administrator account, probably not the ideal way to do it… anyway, that came up with a different error because it didn’t have a power automate premium licence. “Solution “Microsoft 365 Copilot Usage Reporting” imported successfully with warnings: Flow client error returned with status code “Forbidden” and details “{“error”:{“code”:”MissingAdequateQuotaPolicy”,”message”:”Flow could not be activated because you need a [Power Automate Premium license](https://go.microsoft.com/fwlink/?linkid=2297915) or other license that includes premium connectors to save this flow with connection: ‘Http'”,”extendedData”:{}}}”.”
So I’m not sure if there is anything missing with the installation, I think it just couldn’t activate the flows, but I’ll do that with the account that will be running it, which has the premium licence.
Thanks again for your help.
I have discovered that it has failed to import some flows, probably due to that permission issue. So we’ll have to give global admin rights to an account that has the premium licence in order for it to work properly.
Hi Loryan,
We have now successfully imported the solution using a global administrator account that we’ve granted a per user power automate licence to (apparently this is synonymous with a premium power automate licence) this ensures it has the permission to create tables in the dataverse (global admin) and the premium rights to use the premium connector to the dataverse. The global admin has then shared the flows with the account that we want to actually run the flows. That account also has a per user licence for power automate. Strangely, three of the flows run with the rights of the global admin (successfully) and the other 2 run with the rights of the account we use to run them (and fail).
We believe that the issue relates to the account we use to run the flows not having any rights to access the data using PowerBI or within the powerautomate solution explorer when you look at the tables. It simply says in the table view in solution explorer “You don’t have permission to view this data”. Unfortunately we cannot work out how to successfully share access to these tables with the account that will be running the flows and accessing the data from PowerBI. Can you offer any advice on this please?
Thanks!
Hi Stephen, I’m a bit lost here to be honest as I know of a number of orgs that have imported the solution and gotten it working without having to resort to any kind of admin role (whether Power Platform or Global Admin).
The account that refreshes the data in the Power BI report needs to have access to not just the tables, but the rows in the table.
So, if one account is operating the workflows and/or is used for the connector to Dataverse, then only that account can read the rows.
My suggestion would be to potentially delete the tables, workflows, connection references, environmental variables, the solution itself, and start fresh.
Also, are you importing it into the default environment? You might have more luck if you use a separate environment that your service account has the System Administrator role from Power Platform. This level shouldn’t be required, but certainly the account shouldn’t have an actual Entra ID admin role to run this.
Hi Loryan,
Thanks again. We worked out we needed to grant the system customizer security role in the power platform. We removed the solution and re-added it using the newly upgraded account.
When you say that the historical data importer should take longer to run, what sort of time did you have in mind? We have 60 copilot users, half of whom have only been using it for 4 months. It has already been running for more than a day. Is this to be expected?
Is it still running for those 60 Copilot users?
And are you starting to see historical data showing up in the dashboard?
Hi Loryan,
Yes, it has now been running for 6 days 23 hours and 42 minutes.
The tables indicate that they were last modified 6 days ago.
The Active M365 Copilot Reporter – Entra ID Users shows 6608 rows. I’m assuming that this is every account in our Entra ID system.
The Active Currently Licenced Users table shows 65 rows. This matches every account that has a Copilot licence.
The Active M365 Copilot Interactions v2S table shows 4403 rows. This is where I think the historical records should be, but they aren’t increasing.
The PowerBI report shows historical data (presumably only 4403 data points) and hasn’t changed since the first day I looked at it, despite being refreshed. In the Usage by User tab, it still shows no results found if you try and select a specific username.
Thanks again,
Stephen
Hrm, which workflow is it that’s running for so long? If it’s the Entra ID Users one, then kill it and restart it.
Well, it runs automatically once a week so may as well kill it and wait for the new run to begin.
With the Power BI report – are you using the desktop, or has it been published?
If desktop, you may need to clear the cache in the desktop PBI app and then manually refresh again.
Thanks again Loryan,
This is the historical importer that is still running. The PowerBI report has been published.
Regards,
Stephen
Ah, in that case it’s not uncommon for it to take a long time, but not for that many users.
I would probably cancel it.
As for why the user filtering isn’t working, I’m not sure. That should be a simple match of records.
Is the published report set to auto refresh?
Thanks. It is set to auto-refresh. I was thinking of trying to remove everything and start again. I’m worried that the problems we’re seeing are caused by all our permission issues at the start. I had read that when you delete a solution it deletes all the dataverse tables that belong to the solution and everything associated with the solution is removed. However, it really didn’t look like that to me, because when we re-imported the solution, the scripts and environment variables are still listed as being owned by the global administrator account involved in our early attempts. So I think I need to research how to delete everything and begin again completely cleanly.
Yeah, deleting a solution doesn’t delete the items. Those need to be deleted manually.
It’s annoying.
Loryan, thanks for your support and for this great tool. We’re now getting meaningful data from it!
Regards,
Stephen
Glad to hear it!
Hi there,
I am getting the following:
CopilotCurrentlyLicensedUsers
The key didn’t match any rows in the table.
CopilotInteractions
The key didn’t match any rows in the table.
EntraIDUsers
The key didn’t match any rows in the table.
CopilotInteractions-First
The key didn’t match any rows in the table.
Users-Managers
The key didn’t match any rows in the table
any idea how to fix this?
Hi Abdel, are you able to elaborate on where you’re seeing that message, and what you’ve done to get to this point?
i’m getting same issue as soon as i try to refresh / load the report
Hi Loryan, is there a way to import theses tables elsewhere than Dataverse, cause I dont have the Power Automate Premium license. Thanks!
You’re going to need the license for the HTTP action as well.
It’s a fairly small price to pay for the value it brings.
as soon as i try to refresh the report i get following errors:
Load
1 query is blocked by the following errors:
CopilotCurrentlyLicensedUsers
The key didn’t match any rows in the table.
CopilotInteractions
The key didn’t match any rows in the table.
EntraIDUsers
The key didn’t match any rows in the table.
CopilotInteractions-First
The key didn’t match any rows in the table.
Users-Managers
The key didn’t match any rows in the table.
can see tables have been populated with data so no idea why
Any idea how to fix ?
Sorry for the delayed response. Looking at this and your other posts – it seems like it might be a connection issue between Power BI Desktop and Dataverse. I’ve seen similar Microsoft SQL errors on networks where the traffic is blocked.
i’m getting the following powerbi error as soon as i open the report
CopilotCurrentlyLicensedUsers
Microsoft SQL: A connection was successfully established with the server, but then an error occurred during the pre-login handshake. (provider: TCP Provider, error: 0 – The specified network name is no longer available.)
CopilotInteractions
Microsoft SQL: A connection was successfully established with the server, but then an error occurred during the pre-login handshake. (provider: TCP Provider, error: 0 – The specified network name is no longer available.)
EntraIDUsers
Microsoft SQL: A connection was successfully established with the server, but then an error occurred during the pre-login handshake. (provider: TCP Provider, error: 0 – The specified network name is no longer available.)
CopilotInteractions-First
Microsoft SQL: A connection was successfully established with the server, but then an error occurred during the pre-login handshake. (provider: TCP Provider, error: 0 – The specified network name is no longer available.)
Users-Managers
Microsoft SQL: A connection was successfully established with the server, but then an error occurred during the pre-login handshake. (provider: TCP Provider, error: 0 – The specified network name is no longer available.)
Query parameters
any ideas ?
Hi,
Does this report in PowerBI already refresh itself periodically after publishing or do I have to set something?
You need to configure a scheduled refresh as shown in this article: https://learn.microsoft.com/en-us/power-bi/connect-data/refresh-scheduled-refresh
Just to say, I’m using this successfully so thank you for your great work! My feedback for anyone is that you may find you have accounts with different permissions or license allocation (as is mentioned in some reponses above). You can absolutely import this solution using an account with sufficient Power Platform permissions only (and no PA premium license). You can then retrospectively configure both the solution, Power Platform environment and flows to use an account with a Power Automate Premium license.
There are probably better ways to do the following, but this worked for me:
– Install the solution. Note: flows will install but some will fail to enable due to Connection issues
– Set your Power Automate Premium user as Primary owner for each flow
– Configure and apply a new Connection for said PAP user in the Solution (under Connection References)
– Create a new security role for the tables with the required read/write perms and update the role in PP for the solution to apply to your PAP user
– Enable flows
– Complete the steps as directed in the blog and do the PowerBI stuff
– Run the primary flows
That’s great, thanks for sharing those steps!
I do recognise that I may not always nail the installation steps as there’s only so many times I do it myself. 🙂
And I’m very happy it’s working well for you!
Hi @Loryan Strant,
I am getting an below error when I select “Apply Changes” in Power BI. I have already connected Dataverse environment using the host address. I also checked and all flows are running without any issue
CopilotCurrentlyLicensedUsers
The key didn’t match any rows in the table.
CopilotInteractions
The key didn’t match any rows in the table.
EntraIDUsers
The key didn’t match any rows in the table.
CopilotInteractions-First
The key didn’t match any rows in the table.
Users-Managers
The key didn’t match any rows in the table
Did you check if there were any rows in the tables yet?
Action ‘List_rows_-_currently_licensed_users’ failed: Principal user…is missing prvReadls_CurrentlyLicensedUsers privilege — I have read only access and also I have power automate premiums.. still getting this error
I’m not following here. If you’ve got read only access, surely the other workflows would be failing to write to the tables in the first place?
Hi Strant,
Not sure if you are still reviewing these comments but unfortunately we encounter an issue when we want to open the PowerBi Report file.
We get the following error:
“Microsoft SQL: A connection was successfully established with the server, but then an error occurred during the pre-login handshake. (provider: TCP Provider, error: 0 – The semaphore timeout period has expired.)”
We get the same error for “CopilotCurrentlyLicensedUsers”, “CopilotInteractions”, “EntraIDUsers”, “CopilotInteractions-First” and “Users-Managers”.
Thanks in advance for anyone’s help!
That sounds like you’re network is blocking access to Dataverse from the Power BI desktop app.
I’ve experienced this myself.
I’d suggest trying from another network (e.g. tethering off your phone) and see if it works, as that’s what I’ve had to do.
Is it possible to include users who have the more basic Microsoft 365 Copilot Chat (included in E3)? These are users who do not have the full Microsoft 365 Copilot license, but who we are encouraging to use the more basic copilot functionality and want to monitor adoption.
Hey Richard, I’m currently trying to figure this one out myself.
Unfortunately the same API endpoint doesn’t work for unlicensed users, so that rules it out.
I’m not sure if the usage shows up in the audit log, I would hope it would – but I don’t advocate that method.
Keep watching this space – I’ll do a post soon with some updates I’ve found along the way on other things.