
From a capture box to this
● Page current 5 September 2026 · every chart computed from the record on 3 September 2026, AEST
On 24 April 2026 Station was a text box, a local AI that asked you one awkward question about whatever you’d typed into it, and a page that listed what you’d said so far. That was the whole thing.
This page is the honest version of what happened next — what it started as, in my own words at the time, every turning point with the date it actually landed on, and then a set of charts that count the growth rather than describing it. Not one figure in those charts is typed in by hand — every one of them is regenerated from the code’s own history and Station’s own database by a script that ships in the same folder as this page. The dates and the two columns just below come out of the first commit’s own files and the April screenshot, read by hand and cited as I go.
Prefer to watch? Here it is in 92 seconds, narrated, with captions.
Then, and now
Same app, same front page, nineteen weeks apart.
| 24 April 2026 | 3 September 2026 | |
|---|---|---|
| Front page | a capture box and four counters | eight queues, each one a thing waiting on me |
| Places to go | 17 links in one row across the top | 92 screens, 67 of them in the menu |
| Application code | 4,519 lines | 154,792 lines |
| Runs on a schedule | 5 jobs | 86 jobs and 24 agents |
| Written-down decisions | 11 | 271 |
Where those come from: the two front-page rows are read off the two screenshots below. Everything else in the right-hand column is from the charts further down. The left-hand column is measured the same way, but against the code as it stood on the first day — including the 5 jobs, which is the same count of scheduled work that gives 86 today, run against the first commit instead of today’s.
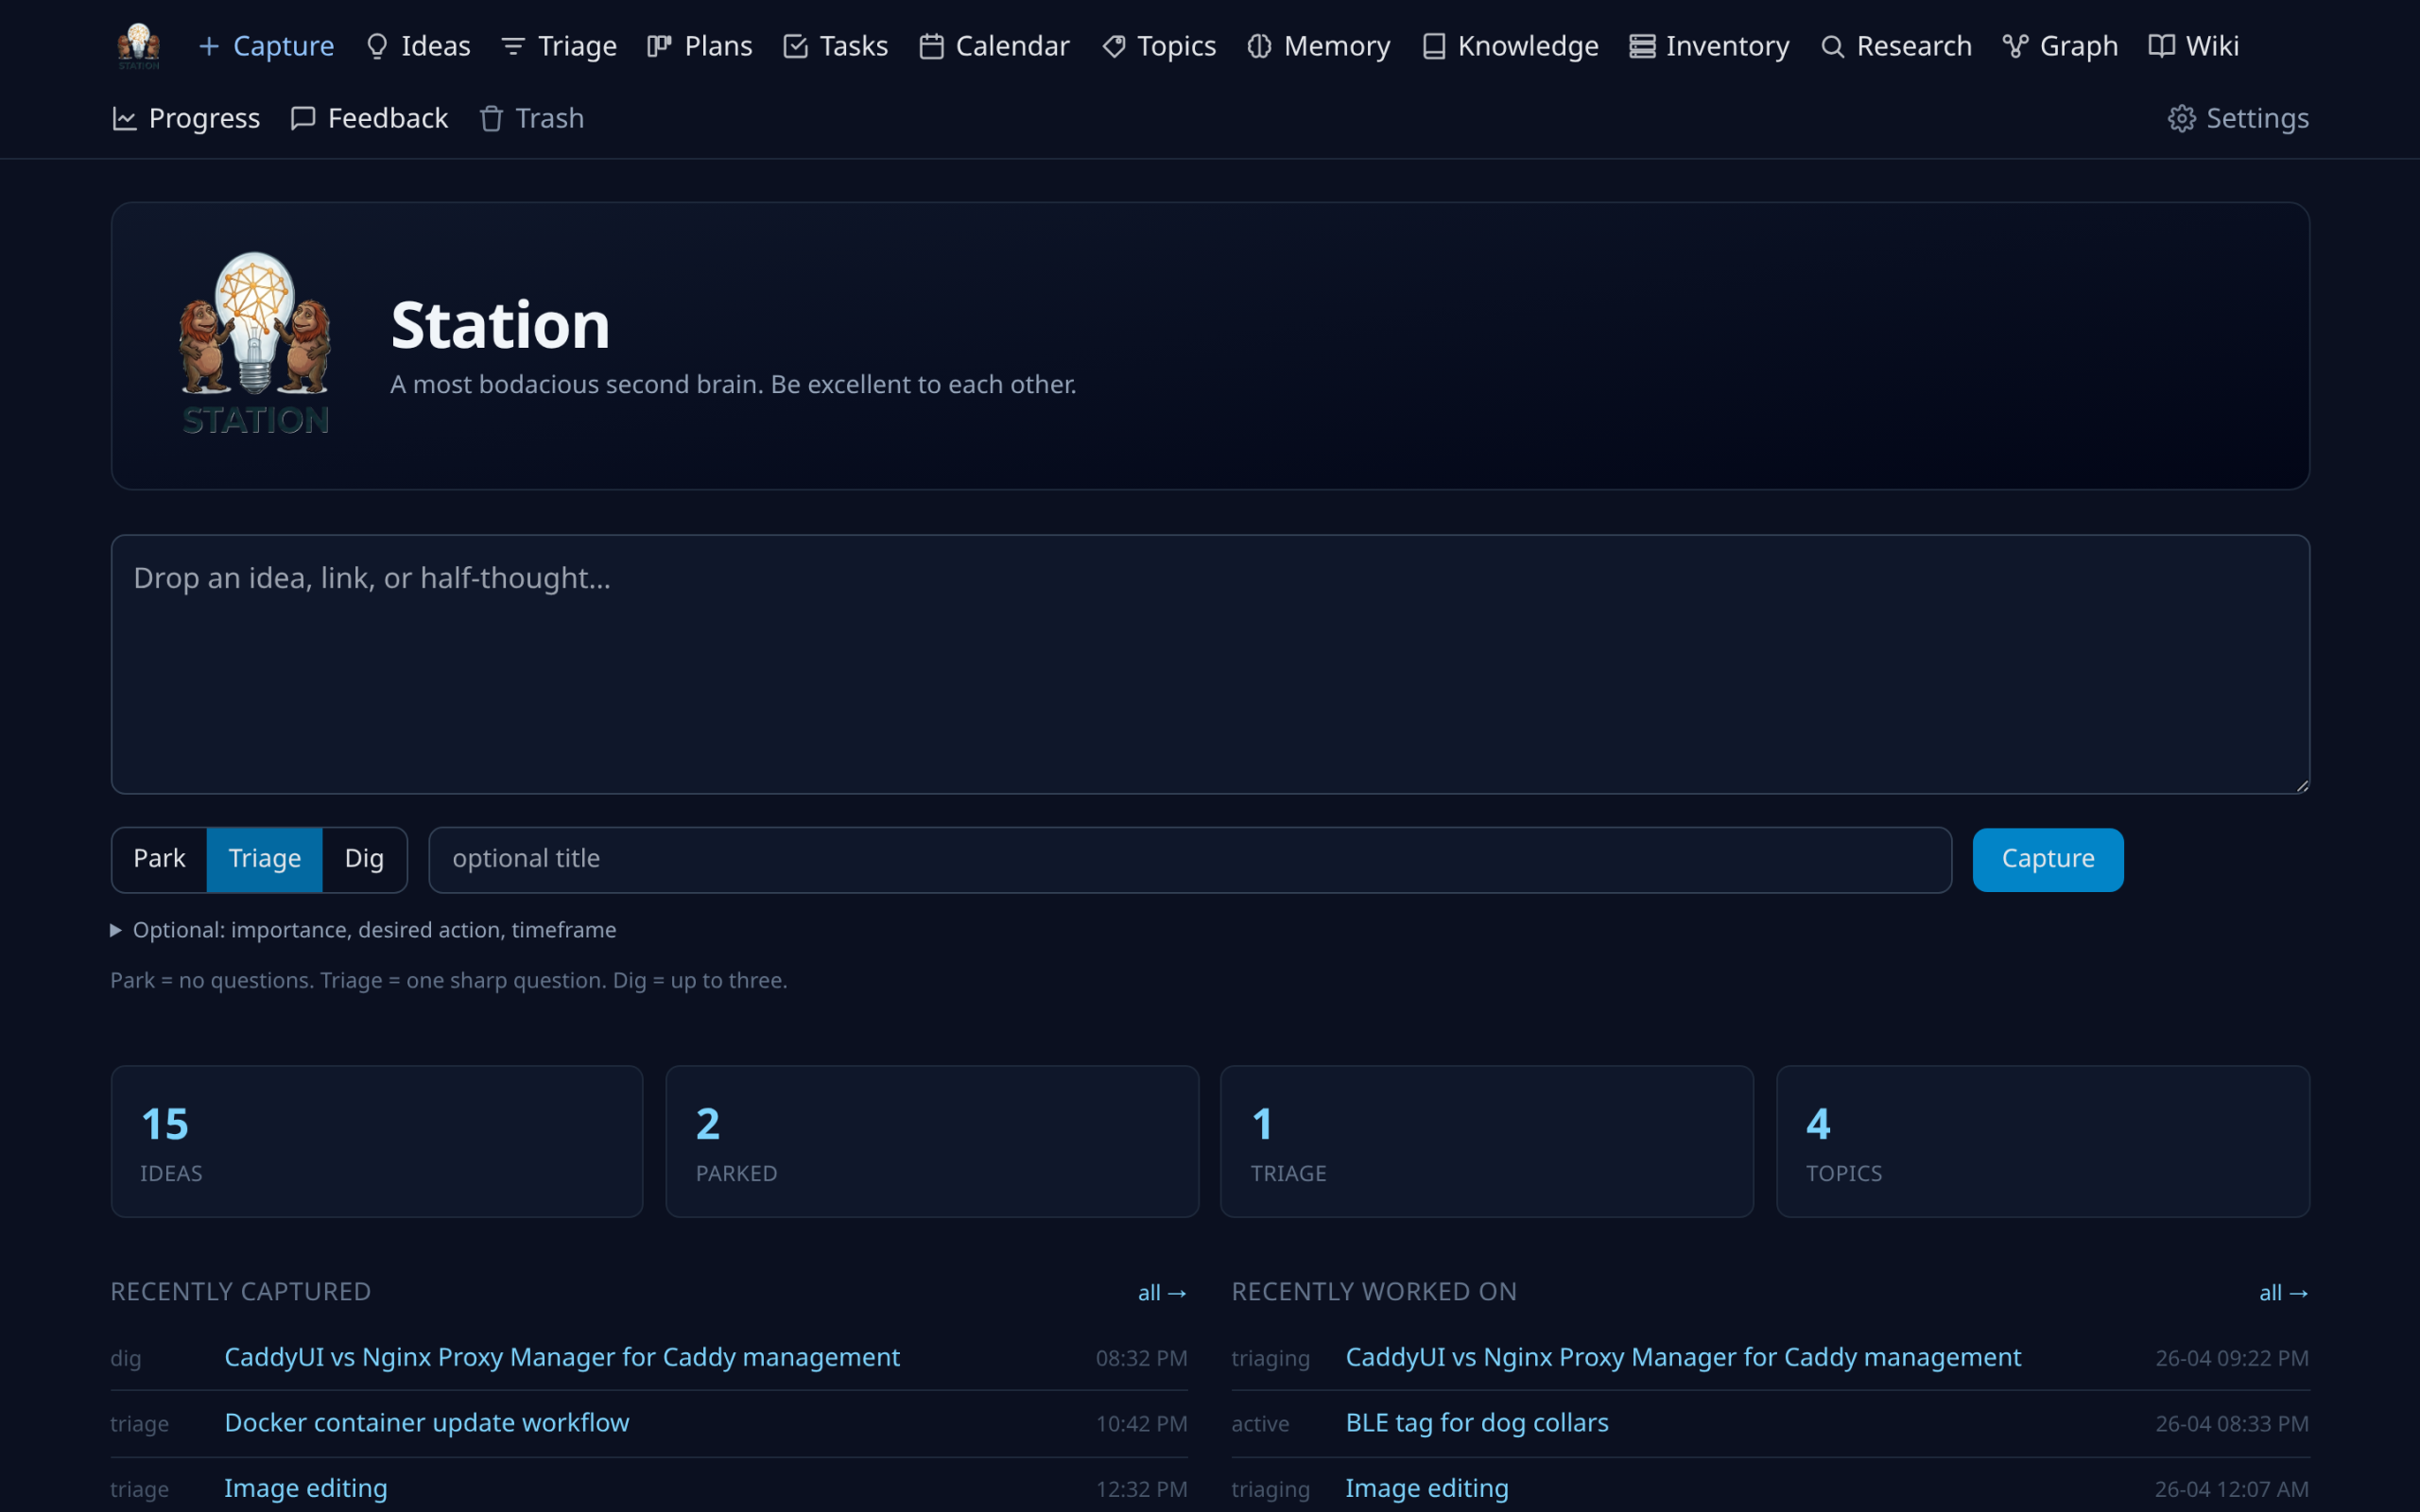
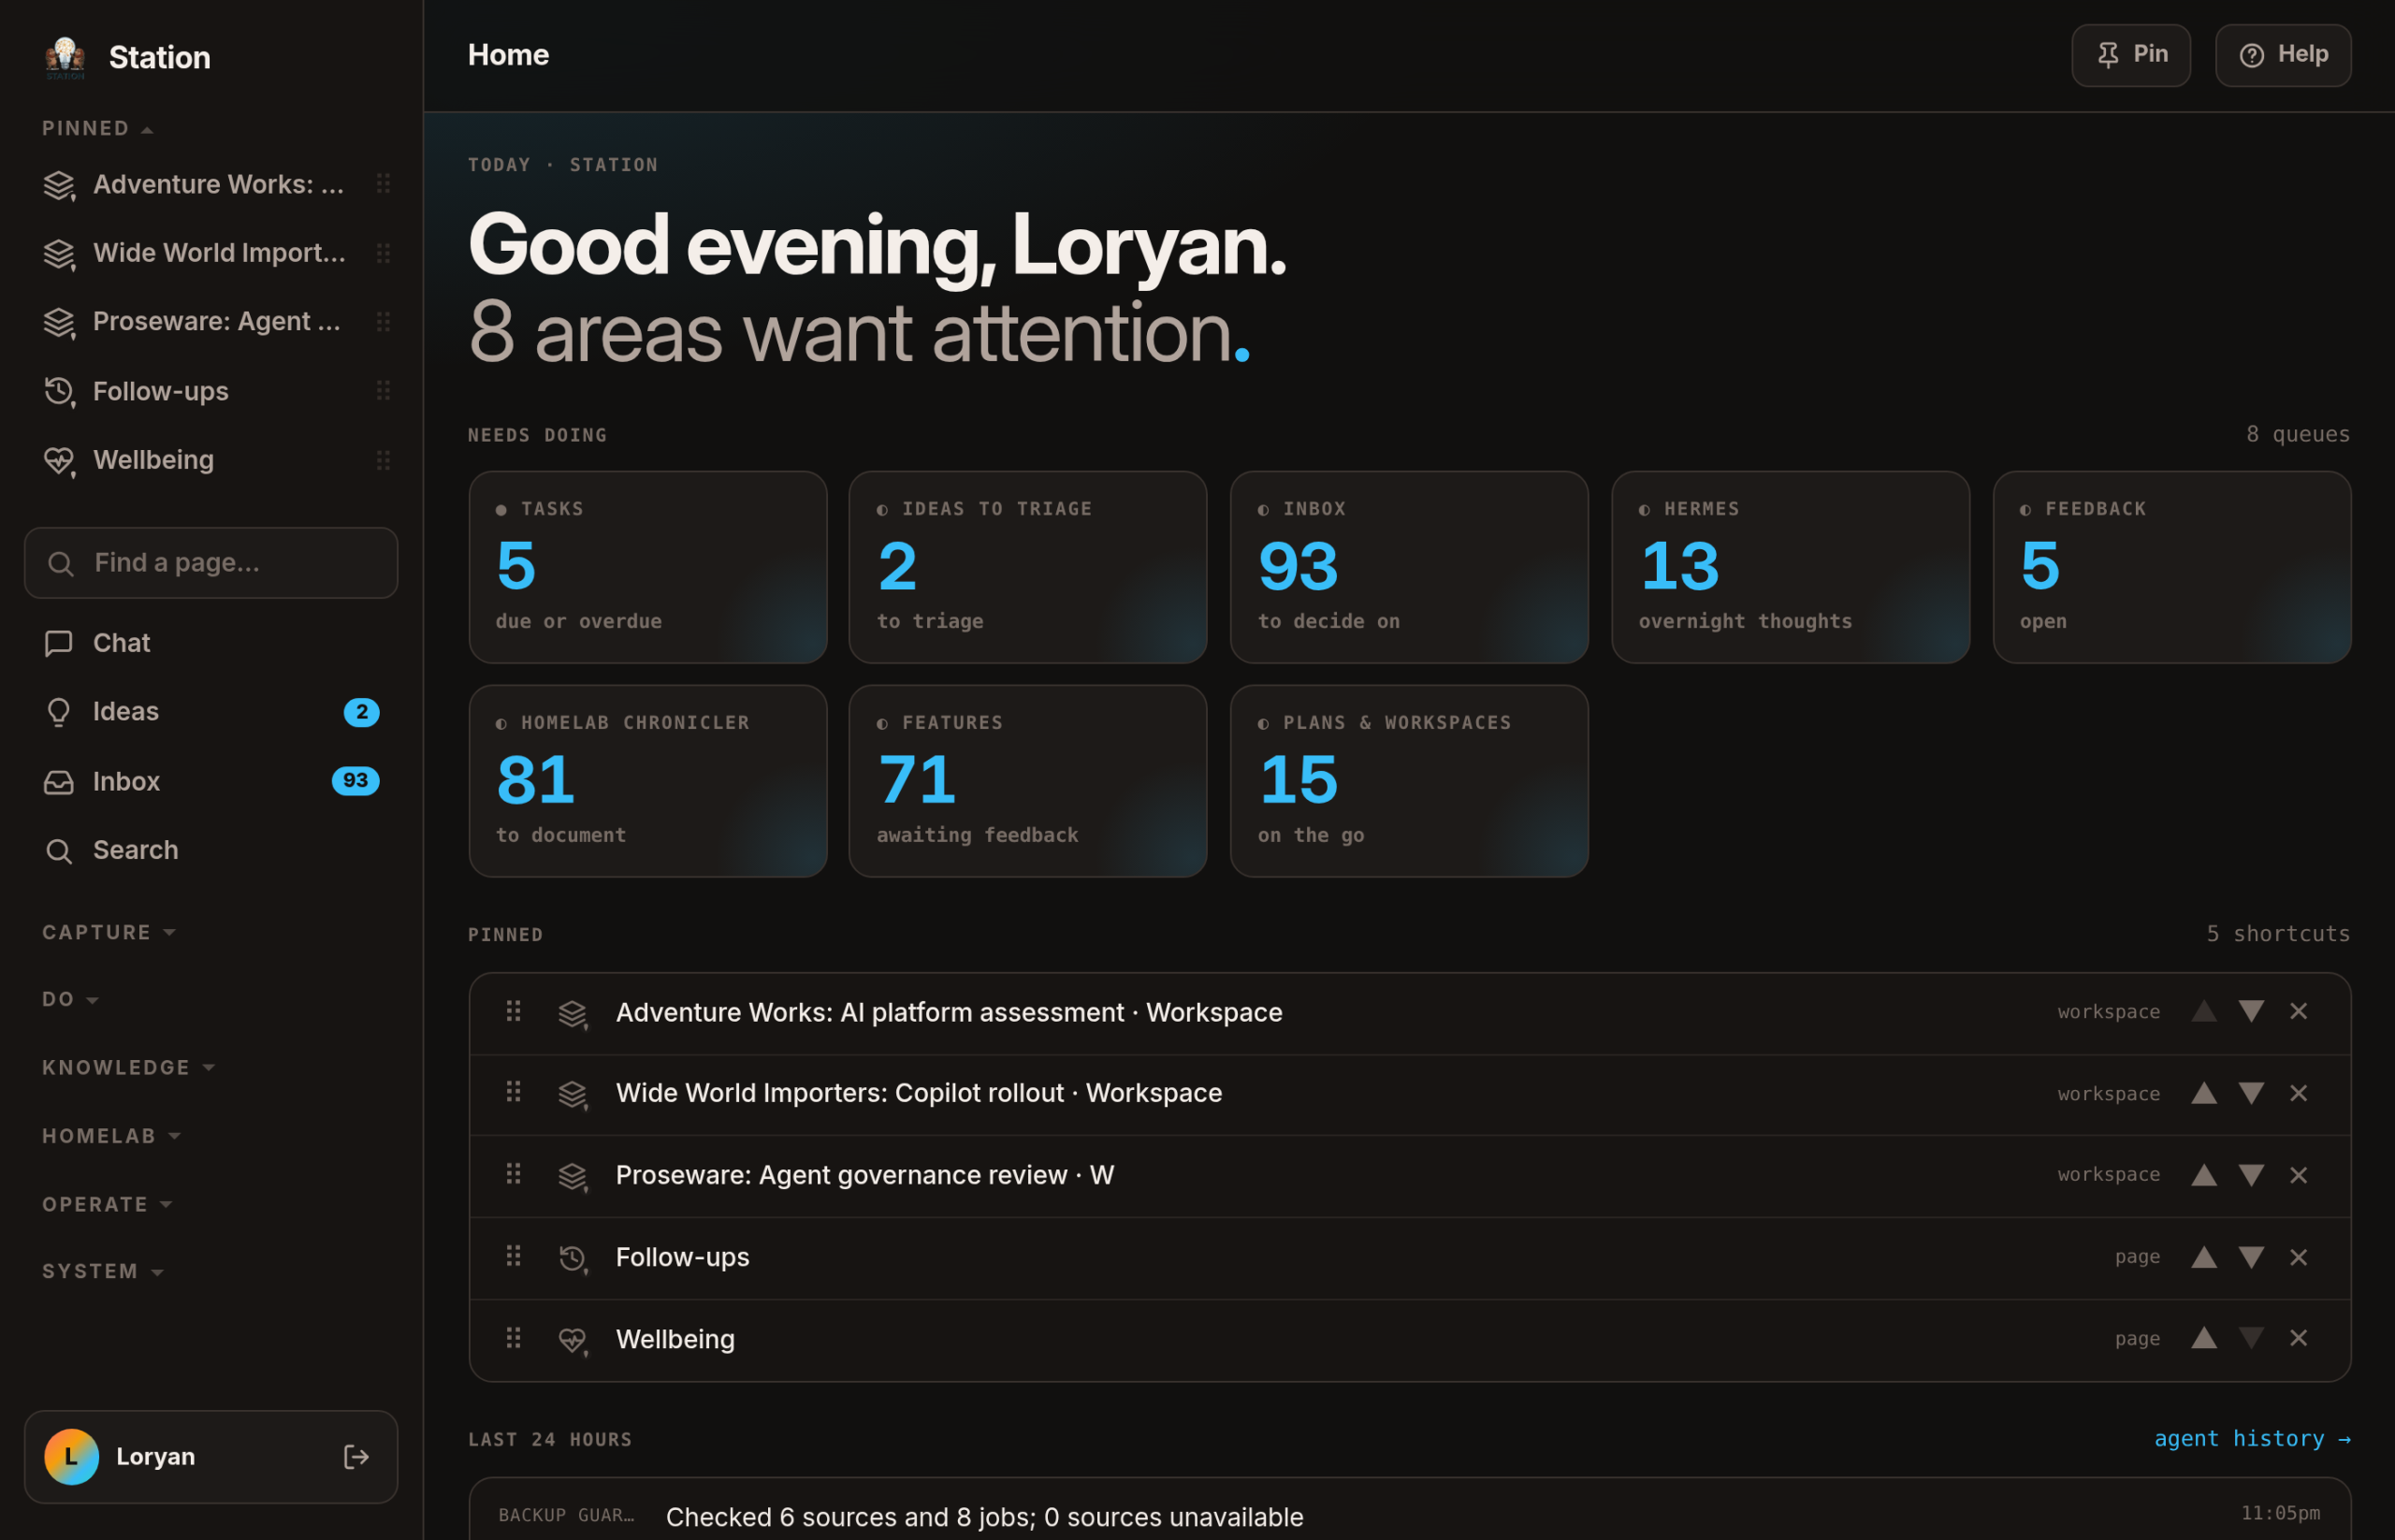
The second one is signed in as a shared test account rather than as me, and the three pinned client names down the left are stand-ins — real work, invented companies. Everything else is the real thing on the real machine.
What it was on day one
The first commit is dated 24 April 2026 and its message is a fair summary of the ambition at the time:
Initial import of Station (Phase 0 docs through Phase 2 graph kickoff)
Two days earlier, on 22 April 2026, I’d written the first eight decisions down before writing any code — what language, which local AI, where the memory lives, and a rule that documentation is part of every change rather than something you promise to do later. That last one is the reason this page can exist at all: it’s why there’s a dated record of everything that follows.
What actually worked on day one, from the roadmap as it stood that week:
- Capture — type a half-thought into a box, or email it in, or post it from a script.
- Challenge — a local AI reads it, digs up anything related it already knows, and asks you the follow-up questions a good colleague would. You pick how hard: Park (don’t bug me), Triage (one sharp question), or Dig (up to three).
- Memory — short structured facts about me, which could be forgotten or replaced but never deleted, so there’d always be a history of what it once believed rather than only what it believes now.
- Knowledge — it read my blog and my public projects, so it could reason about me using evidence rather than vibes.
- A graph — when two ideas looked closely related it quietly drew a line between them, and rebuilt the whole map at 4am.
And a note in the first batch of decisions that I’d deliberately shipped it with no login at all, because it was one person on a home network — with the reasoning written down that a future decision would have to introduce one "when the system is exposed beyond the LAN". That bill came due on 9 July 2026, and the future decision got written.
Why I built it, in April’s words
This is verbatim from the write-up I wrote on 27 April 2026, three days after the first commit. I’ve not touched a word of it:
I have a lot of ideas. Most of them are bad. The ones that aren’t bad usually die because I never wrote them down properly, or I wrote them down in a place I never looked at again.
And on why nothing off the shelf did the job:
Existing tools either capture, but don’t think with you (Notes, Obsidian, plain Markdown) — you have to do all the work of pulling threads. Are great at one thing only (Todoist for tasks, Notion for docs, ChatGPT for brainstorming) — none of them know what the others know. Want my data, badly (you know the ones) — and decide what AI features I’m allowed to use.
Station is what happens when you build the tool you actually wanted, on hardware you control, with a local LLM that doesn’t phone home.
The five things I said I wanted, that same day:
- Knows me without any company owning that knowledge.
- Asks me good questions instead of waiting passively.
- Doesn’t fragment what I think across a dozen apps.
- Plays well with other agents instead of being a walled garden.
- Runs on my own hardware with a local LLM.
Four months later I’d still sign all five. The list didn’t change. What changed is how far "asks me good questions" and "plays well with other agents" turned out to go.
The turning points
In order, each dated from the running record of what changed and why.
The graph stopped being a diagram — 23 to 27 April 2026
On 23 April two ideas that looked alike got a line drawn between them and a map appeared. On 24 April it learned to pull the people, projects and tools out of what I’d written and treat those as points on the map too. By 27 April the map had stopped being about ideas: it stitched ideas, the things Station had read, the facts it remembered, and the machines in my house into one graph. That’s the week it became possible to ask "which of my ideas relate to the thing running on that server" and get a real answer.
It opened itself up to other software — 25 April 2026
One day after the first commit, Station grew a second front door: a standard interface that lets other AI tools use it. Five read-only tools at first, so a research agent — or a chat client on my laptop — could search my ideas and look up what Station remembered, without me copying anything anywhere.
The reasoning I wrote down at the time was blunt about the alternative: build a custom adapter for each client and you’ll be maintaining those adapters forever. Today that surface offers 23 tools.
It learned my house — 26 April 2026
Station started reading the real state of the machines in my house — every server, every service, every container — and putting them on the same map as everything else. This is the thread that eventually became a whole section of the app; the homelab page is what it grew into.
The first agent that *did* something — 6 June 2026
Until June, Station thought and remembered. On 6 June 2026 it acted: a daily job that checks every container in my house for a newer release and emails me what changed. Within two days there were four agents. Today there are 24, and the one that matters most is a monitor that watches everything and only speaks when it has something worth saying.
It went in my pocket — 8 June 2026
A native Android app, tracked properly from 8 June 2026, with the phone-shaped subset: today’s work, triage, capture including voice, search, and a chat with my own brain. Deliberately reachable only from home or over my own private network — no cloud relay, because the entire point is that the data doesn’t leave the house.
It started writing in my voice — 12 June 2026
Give it a topic and a pile of half-thoughts, and it builds a brief grounded in my own blog posts and the transcripts of my own talks — then a coding agent drafts the piece. Not "ask an AI to write a blog post": the vocabulary, the structure and the opinions come out of things I actually wrote.
Workspaces — 23 June 2026, finished 19 August 2026
A place to put everything about one effort — a client engagement, a homelab build — so it stays together. That shipped in June. What took until 19 August 2026 was making it a boundary rather than a folder: a note written inside a client workspace was correctly hidden from the general lists and still turned up in search, on the phone, and in the assistant’s answers. The question that caught it was mine, and it’s quoted in the decision that fixed it:
Should items in project based workspaces be visible outside of the workspace when doing a search? And, should meetings and other content from workspaces be showing up in search history?
Half a container is worse than none, because you think you’re covered. The work page is what that turned into.
It took over my day — 17 June to 8 July 2026
Three separate things that now feel like one:
- 17 June 2026 — inbox triage. It classifies what lands in my mailbox on my own hardware, suggests what to do with it, and gets better from what I choose. It started strictly suggest-only.
- 5 July 2026 — meeting capture. My work meetings offer no transcript I can reach, so a microphone on my own desk listens instead — and it is trained on my voice and keeps only my voice. Anything that doesn’t match my voiceprint is discarded on the spot, never transcribed and never stored; other people in the meeting are not recorded, full stop. From what’s left, Station pulls out only the commitments I actually made — "I’ll send you that report" — and turns each one into a task.
- 7 July 2026 — the evening phone call. On weekday evenings my phone rings with a full-screen call from Station. It interviews me about the day, writes the journal, and captures the work I did but never tracked. It shipped speaking with a borrowed voice; one day later, on 8 July, it started speaking in a clone of my own. Talking to yourself about your day is a strange experience and I recommend it.
It started thinking overnight — 7 July 2026
An agent that reads Station’s brain while I’m asleep and has something for me in the morning. It began as an experiment on 7 July 2026. On 3 September 2026 it had fifteen things to say.
It started running its own development — 8 to 16 July 2026
The strangest thing it grew into, and it has its own page. The dates:
- 8 July 2026 — nothing counts as shipped until it’s registered with a test plan and checked in on at 2, 7, 14 and 30 days. Station can see whether I ever opened the screen, so "did you use it" isn’t a memory test.
- 10 July 2026 — a board of everything being built, sorted by whose move it is next.
- 11 July 2026 — I can start a coding session from inside Station, pointed at one project, with the context Station already holds.
- 16 July 2026 — every finished session is archived, and a small model on my own hardware writes a plain-English diary entry for each day, for each project.
- 21 August 2026 — and then Station deployed something for the first time, including the coding tool that writes its own code.
Wellbeing — 7 August 2026
A health dimension: medication, meals, water, and whether I actually went outside. Two rules were written down before any of it was built — that it measures me against myself and never against a population average, and that stopping a medication never deletes the record, so "what was I taking in June" stays answerable. It has its own page.
The redesign — 10 August 2026
One day. The cool blue-black look was replaced by warm graphite, the row of links across the top became a sidebar, and the menu was regrouped around what you’re doing rather than what the thing is called. The 24-link junk drawer it created in the morning was split apart again by the afternoon, which is roughly how the whole project goes.
One detail I’m glad someone wrote down: the accent colour in the mock-up was a coral that sits too close to the error red for a colour-blind reader — me — so it was changed before it shipped. That’s why nothing on any of these pages tells you something using colour alone. What changed has the full story.
Where that leaves it
Station today is a single self-hosted app on a machine in my house that catches anything I throw at it, argues with it, remembers what it learns, reads the world I publish into and the machines I run, plans the work, runs my inbox and my meetings and rings me in the evening in my own voice to close out the day, watches my health and my house, writes in my style, hands its whole brain to any other AI tool I point at it, and — the part I still can’t quite say with a straight face — runs the software project that builds it. It is 92 screens, 154,792 lines of application code, 86 scheduled jobs and 24 agents, as at 3 September 2026. It is also one user, one database, one container stack, and no microservices anywhere.
What it still isn’t
- It isn’t autonomous. Letting Station start coding work while I sleep was built and then deliberately shipped switched off. Overturning "a human says yes first" is a decision for a person, not a setting.
- It isn’t a product, and it isn’t for sale. One user, one house, no support, no roadmap I owe anybody.
- It isn’t open source. The showcase is public; the code isn’t.
- It isn’t finished, and the roadmap is honest about it. Handing work to someone who isn’t me, deeper research agents, and a proper graph database are all still on the list.
- It isn’t a demo of how tidy this was. A fair amount of what’s above is a description of me being wrong in public and writing down what it cost.
How it grew, in numbers
Eight charts. Every one is regenerated from a source that can’t be fudged — the code’s own history, the record of every change proposal, or Station’s own database — and every one carries the date it was computed. The table behind each chart is folded up underneath it.
Who was typing
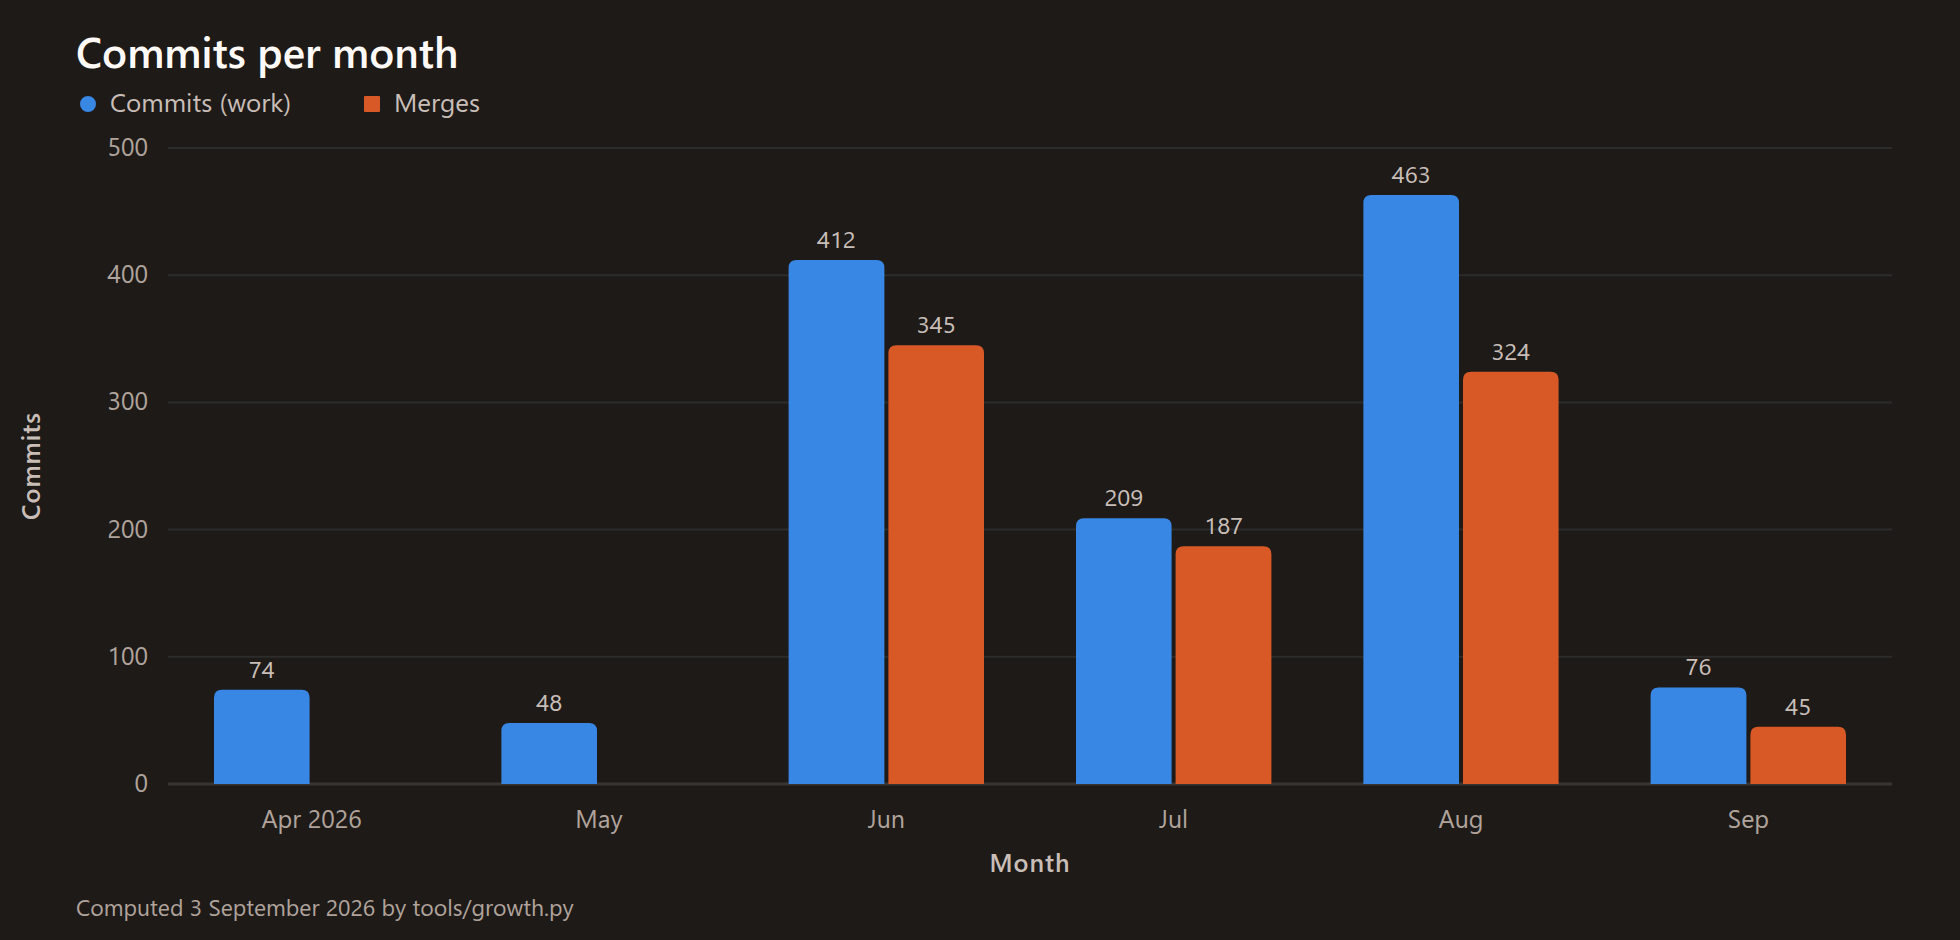
Nothing merges in April and May because there was nothing to merge into — I was typing every line myself. From June the second bar shows up and never leaves: that’s the month the work stopped being mine to type, and started being changes proposed by an agent that I had to accept.
The numbers behind this chart
| Month | Commits (work) | Merges |
|---|---|---|
| Apr 2026 | 74 | 0 |
| May 2026 | 48 | 0 |
| Jun 2026 | 412 | 345 |
| Jul 2026 | 209 | 187 |
| Aug 2026 | 463 | 324 |
| Sep 2026 | 76 | 45 |
September is a part month — it stops on 3 September 2026.
How much code there is
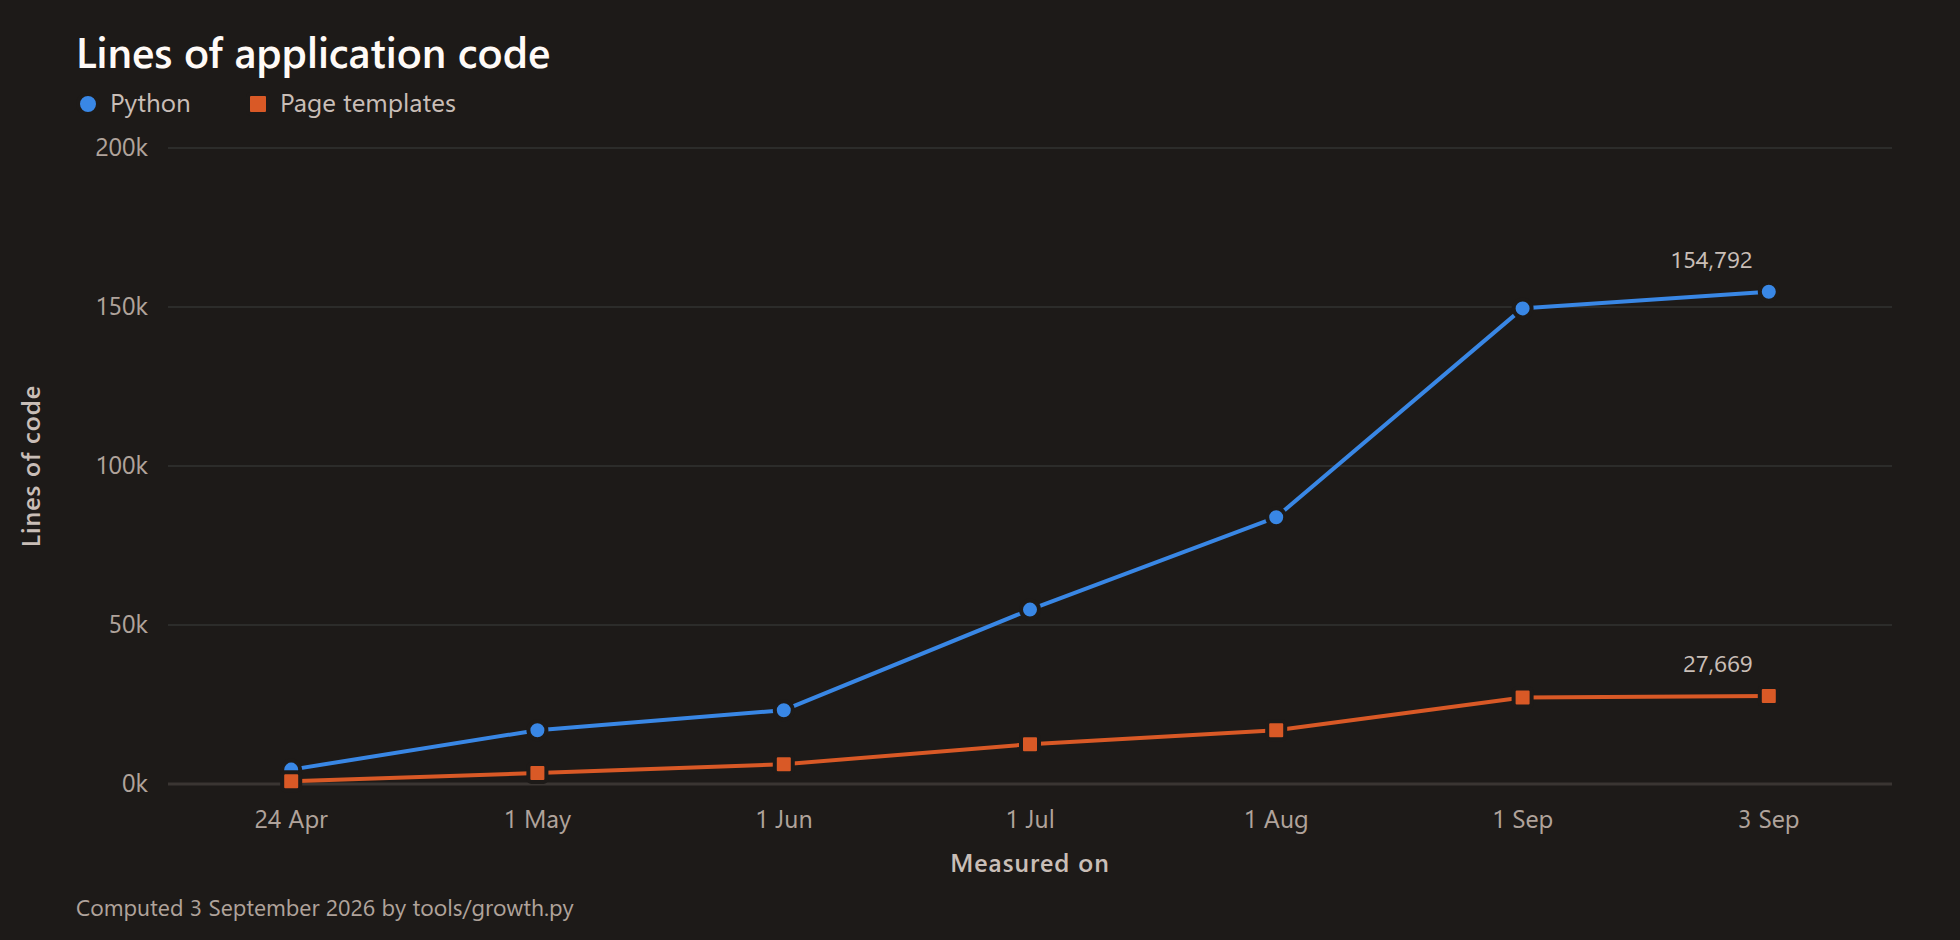
Thirty-four times the code in nineteen weeks: 4,519 lines on the first day, 154,792 on 3 September 2026. The steepest stretch is August, after the point where every change had to pass its own tests and write its own documentation before it could land — which is the opposite of what I’d have guessed.
The numbers behind this chart
| Measured on | Python | Page templates |
|---|---|---|
| 24 Apr | 4,519 | 902 |
| 1 May | 16,941 | 3,449 |
| 1 Jun | 23,180 | 6,237 |
| 1 Jul | 54,835 | 12,534 |
| 1 Aug | 83,915 | 16,923 |
| 1 Sep | 149,544 | 27,197 |
| 3 Sep | 154,792 | 27,669 |
Counted at the last change before each date: every line of the application itself. Tests, database migrations and documentation aren’t counted here — including those roughly doubles it.
How a change gets in
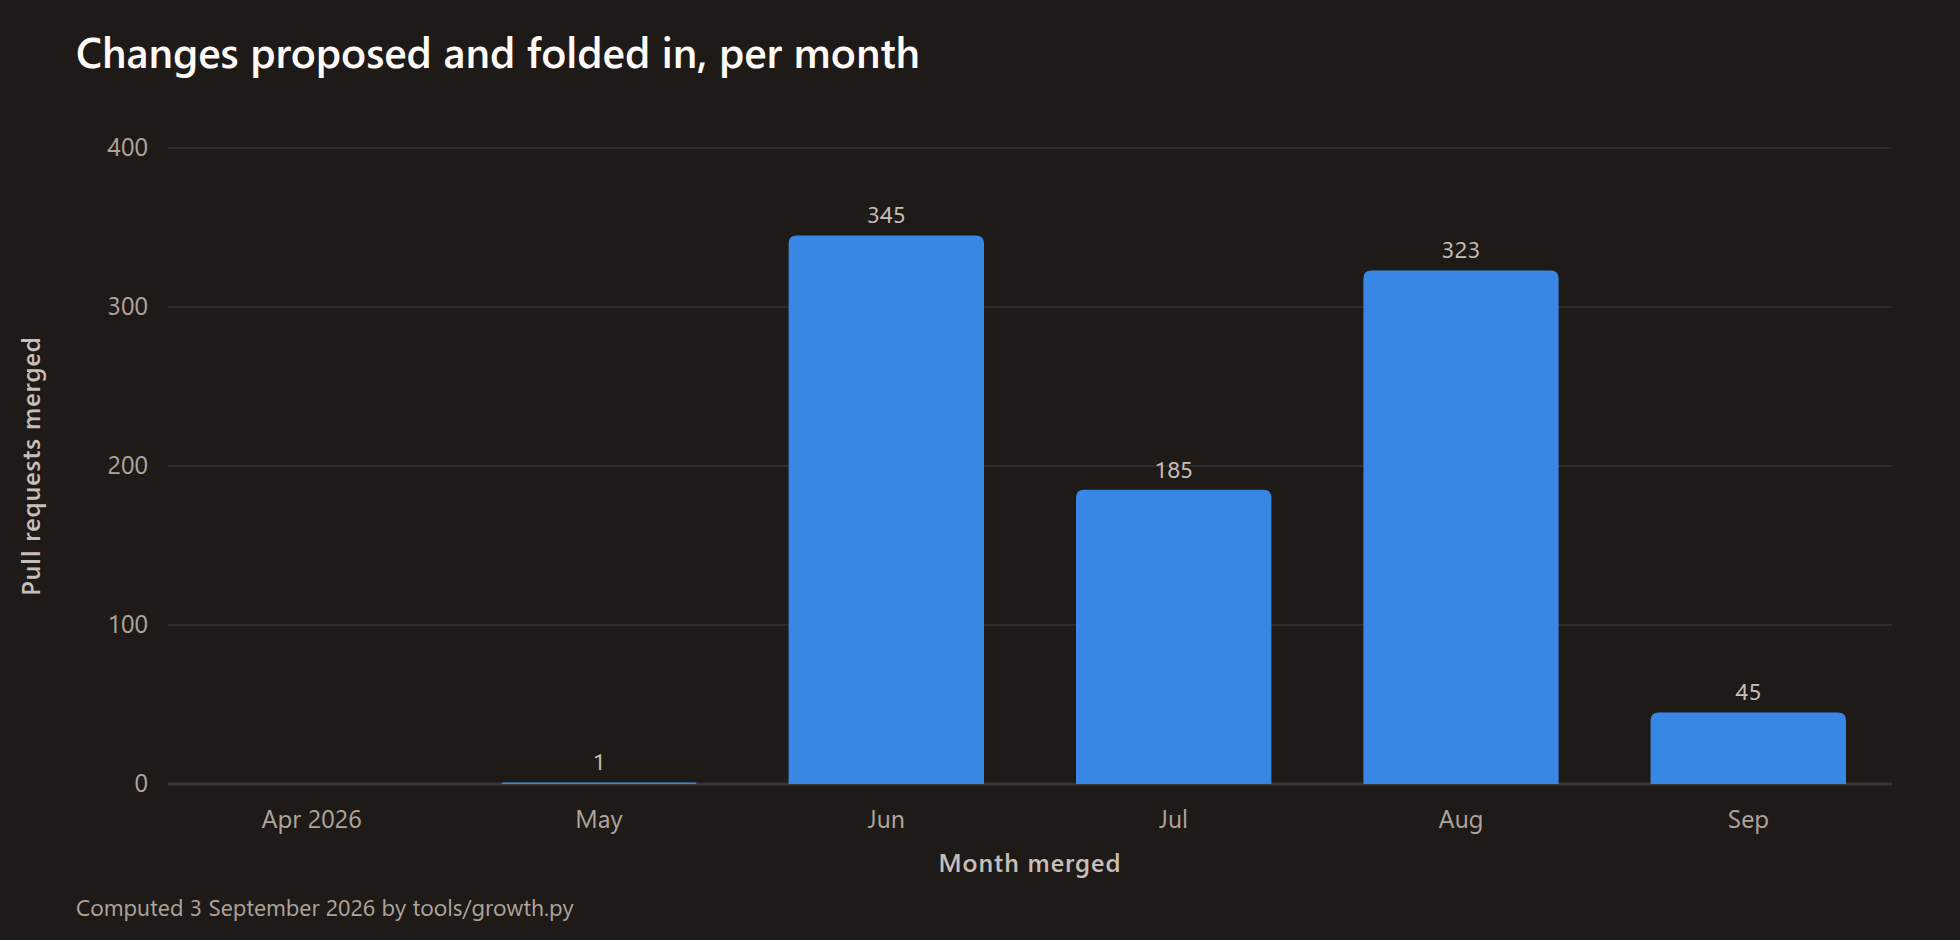
899 changes have been proposed, reviewed and folded into Station since 31 May 2026. One in May, and then it becomes the only way anything gets in.
The numbers behind this chart
| Month merged | Merged pull requests |
|---|---|
| Apr 2026 | 0 |
| May 2026 | 1 |
| Jun 2026 | 345 |
| Jul 2026 | 185 |
| Aug 2026 | 323 |
| Sep 2026 | 45 |
Counted by the month each one was merged, not opened — so a change counts on the day it actually landed.
Writing it all down
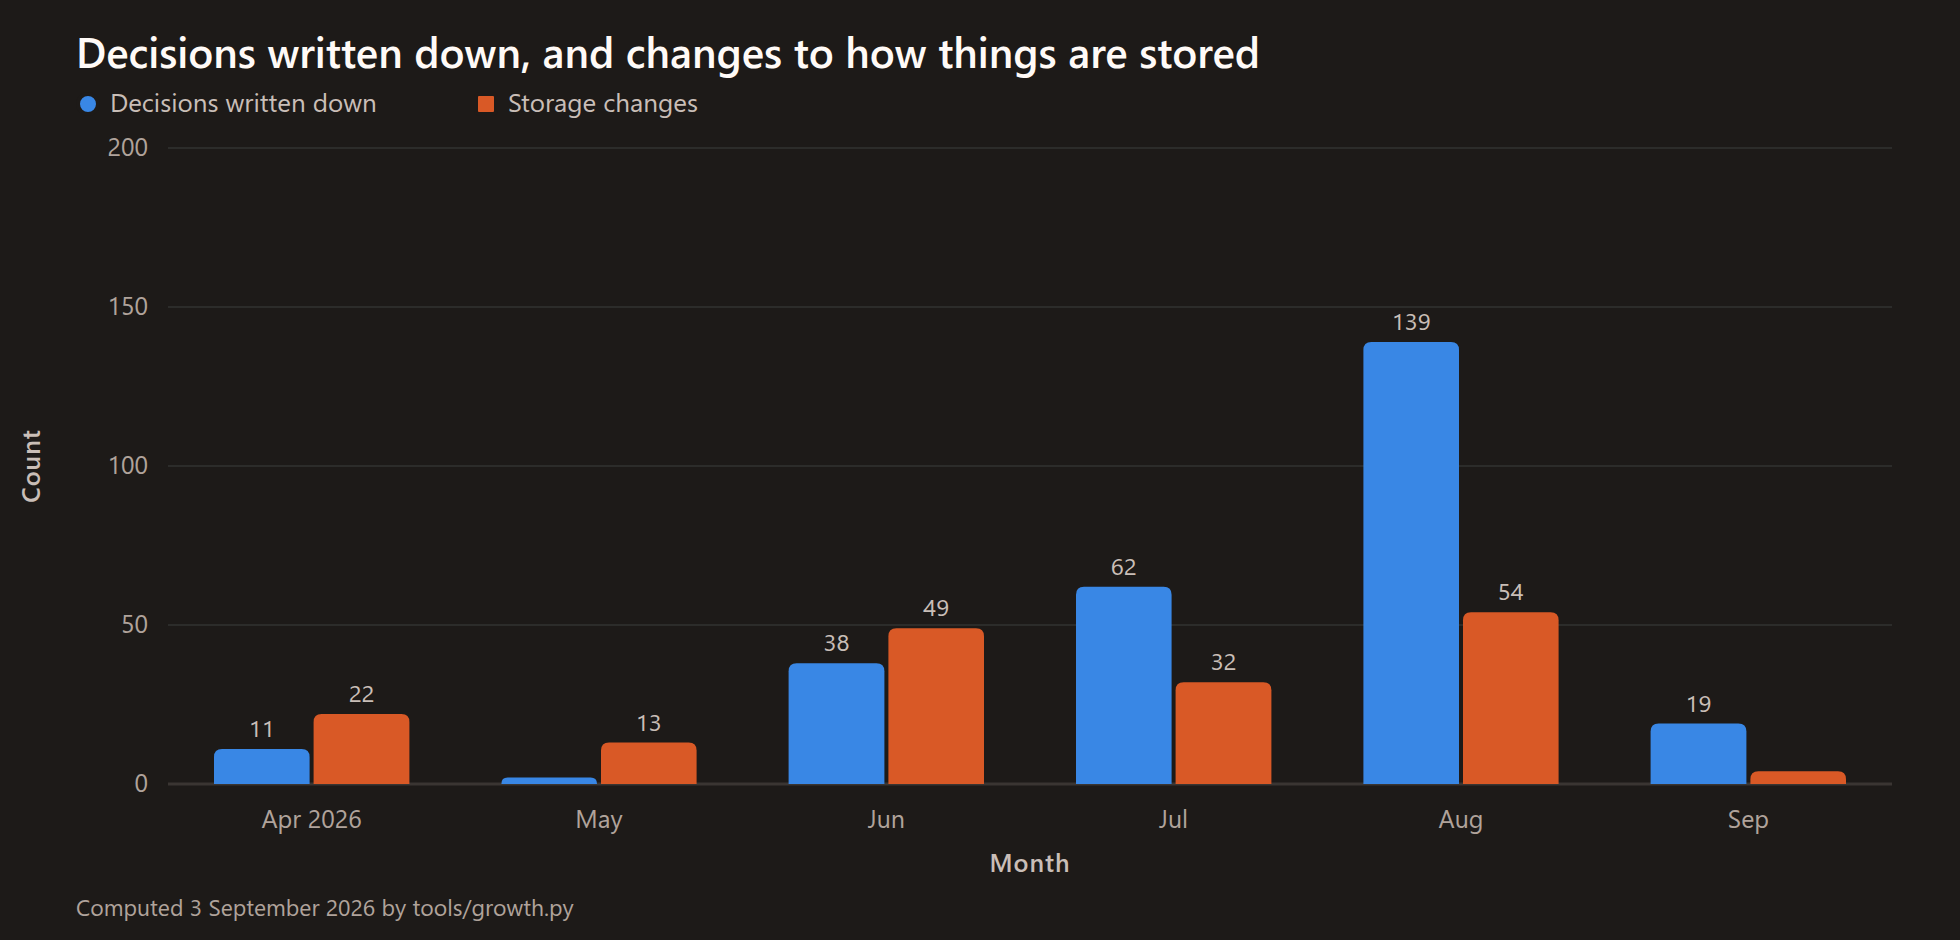
271 decisions and 174 changes to how information is stored, as at 3 September 2026. August alone accounts for 139 of the decisions — the month the redesign, wellbeing and the work side all landed at once.
The numbers behind this chart
| Month | Decisions written down | Storage changes |
|---|---|---|
| Apr 2026 | 11 | 22 |
| May 2026 | 2 | 13 |
| Jun 2026 | 38 | 49 |
| Jul 2026 | 62 | 32 |
| Aug 2026 | 139 | 54 |
| Sep 2026 | 19 | 4 |
One decision carries no date of its own and was dated by the day the record first saw it. Most storage changes don’t carry a date either, and were dated the same way.
The record that never stopped
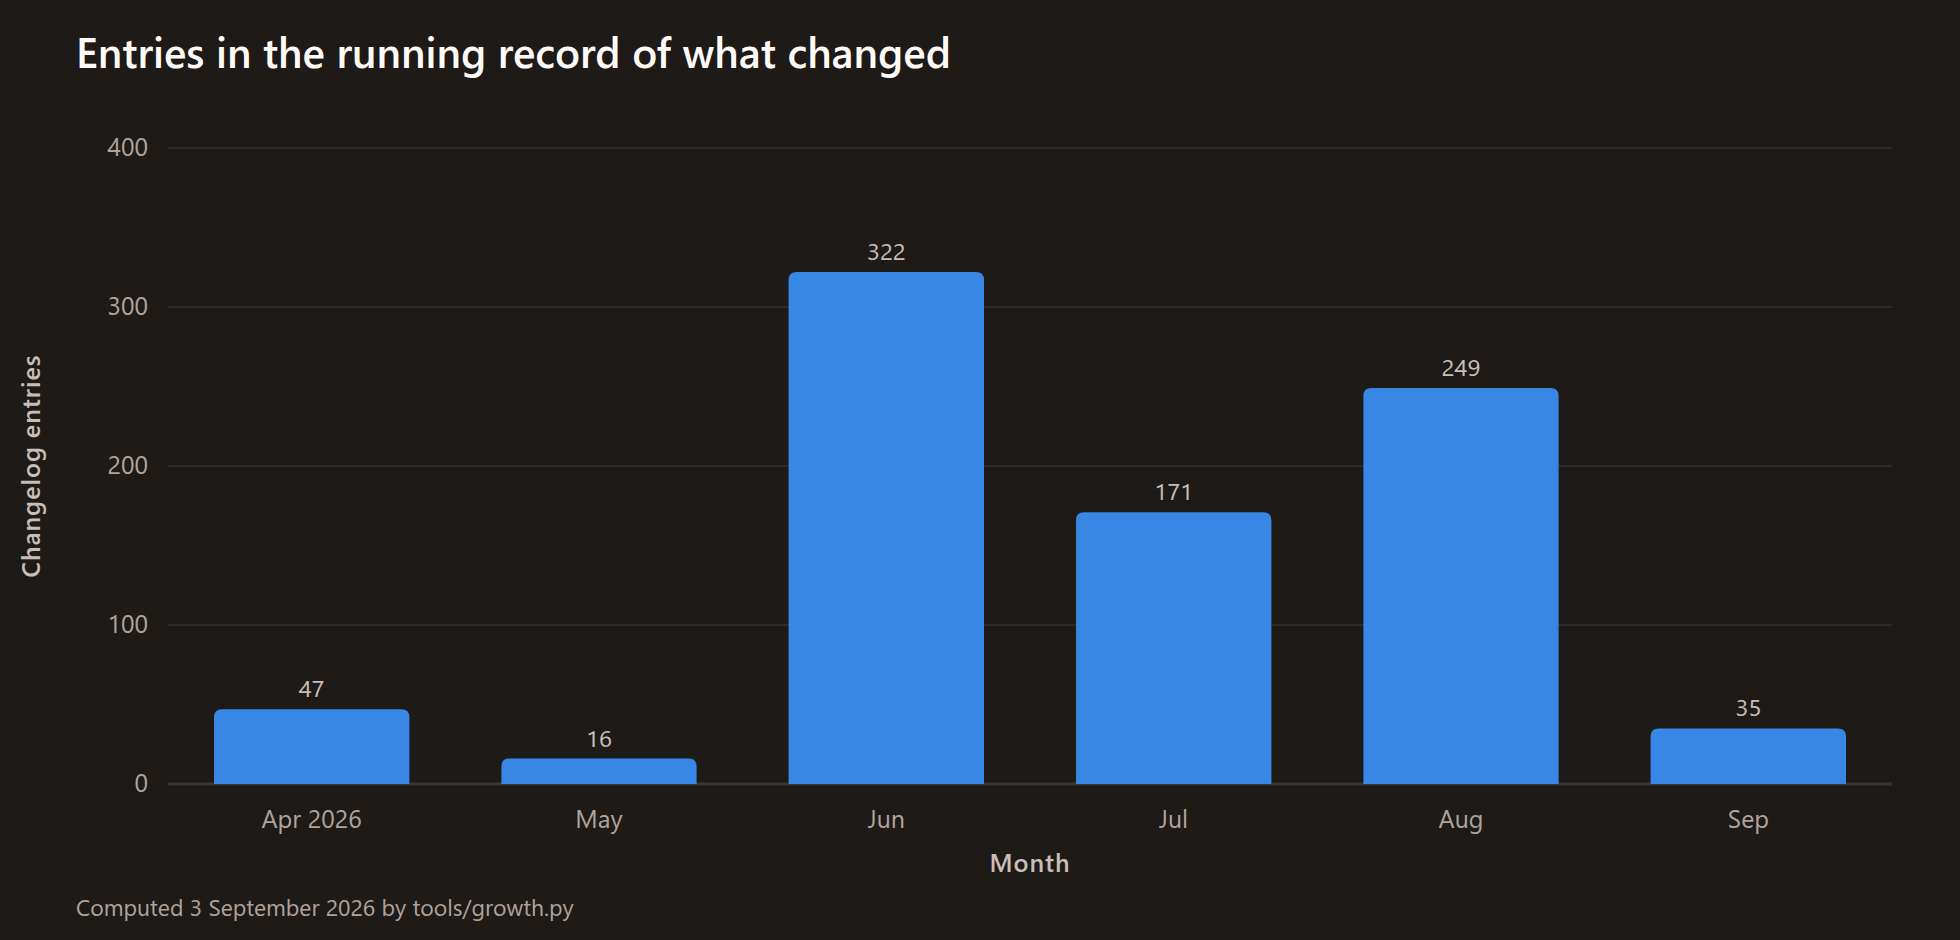
840 entries explaining what changed and why, in plain English, starting two days before the first line of code. This is the one artefact that has never stopped growing, and it’s the reason every date on this page has a source.
The numbers behind this chart
| Month | Changelog entries |
|---|---|
| Apr 2026 | 47 |
| May 2026 | 16 |
| Jun 2026 | 322 |
| Jul 2026 | 171 |
| Aug 2026 | 249 |
| Sep 2026 | 35 |
What it gathered without me
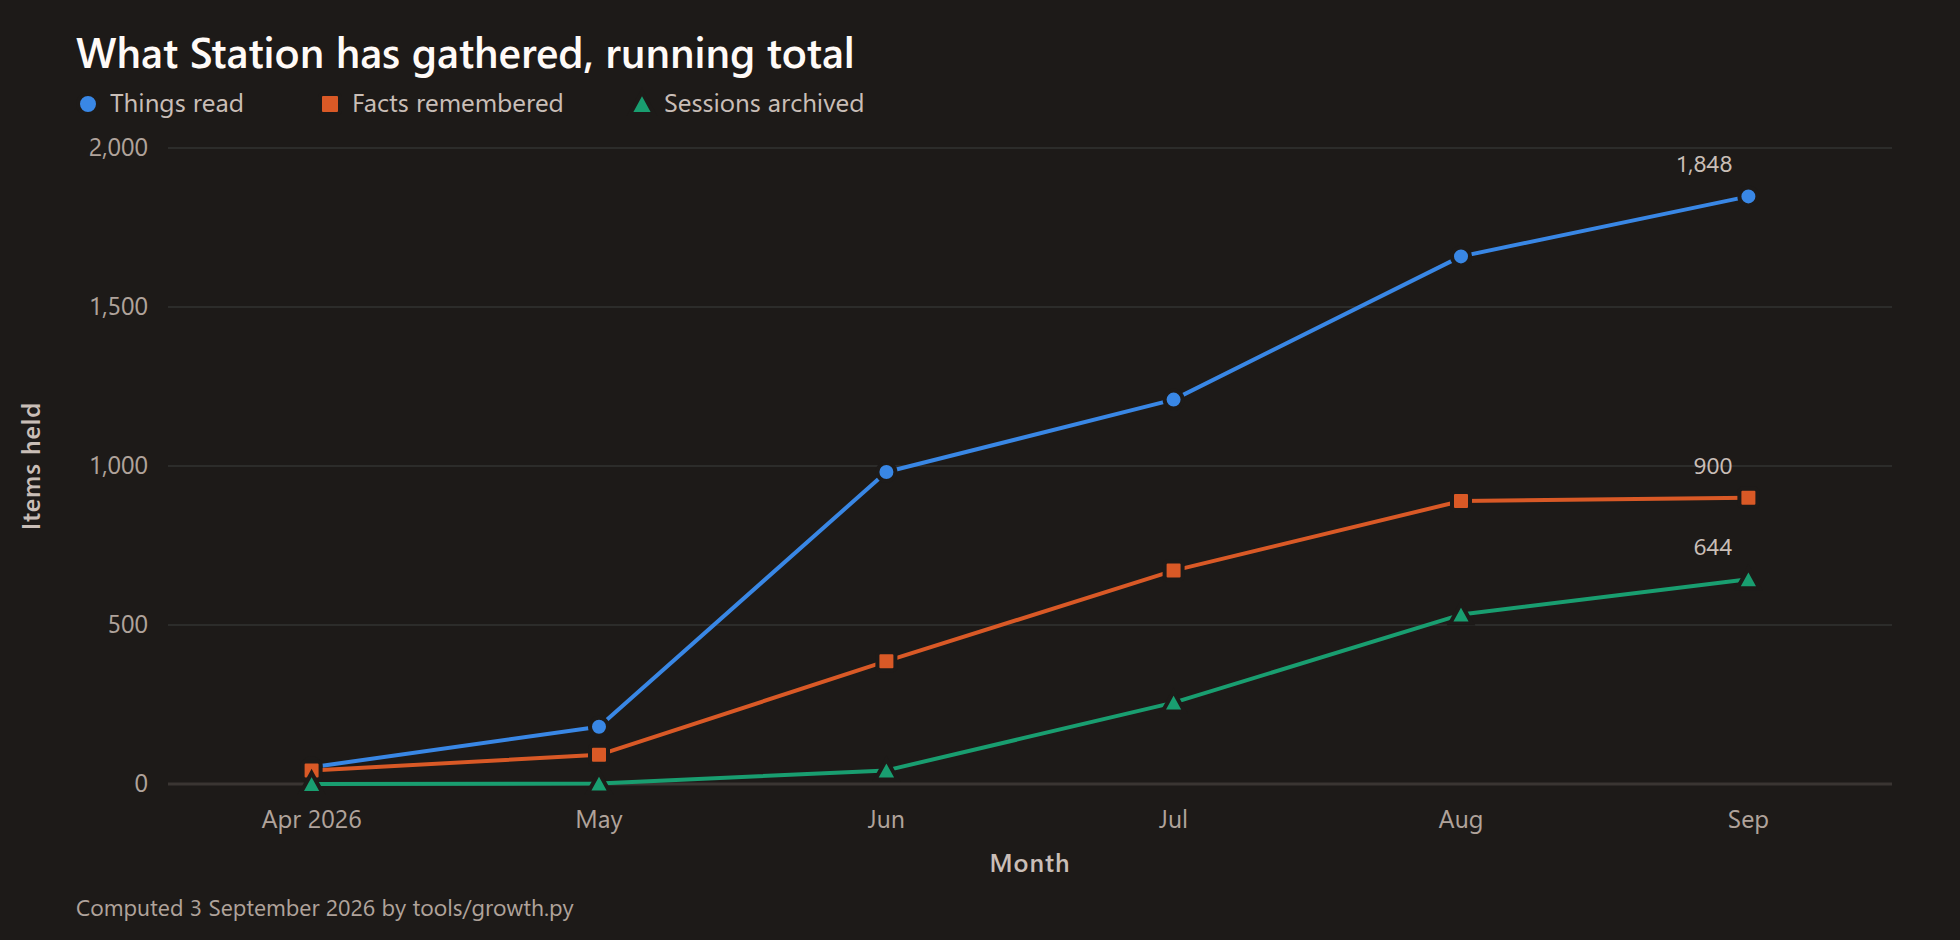
This is the chart I find most telling. What grows isn’t what I typed in — it’s what Station read on my behalf (1,848 things), what it remembered about me (900 facts), and the 644 coding sessions it has archived and turned into a diary.
The numbers behind this chart
| Month | Things read | Facts remembered | Sessions archived |
|---|---|---|---|
| Apr 2026 | 53 | 42 | 0 |
| May 2026 | 180 | 92 | 1 |
| Jun 2026 | 981 | 386 | 43 |
| Jul 2026 | 1,209 | 671 | 256 |
| Aug 2026 | 1,659 | 890 | 533 |
| Sep 2026 | 1,848 | 900 | 644 |
Running totals, from Station’s own database at 9pm AEST on 3 September 2026. Things read are dated by when Station fetched them; facts by when they were first written; sessions by when the session ran. The last of those three moves during the day — it went up by two while this page was being written, which is either charming or annoying depending on how much you like round numbers.
What I actually type in
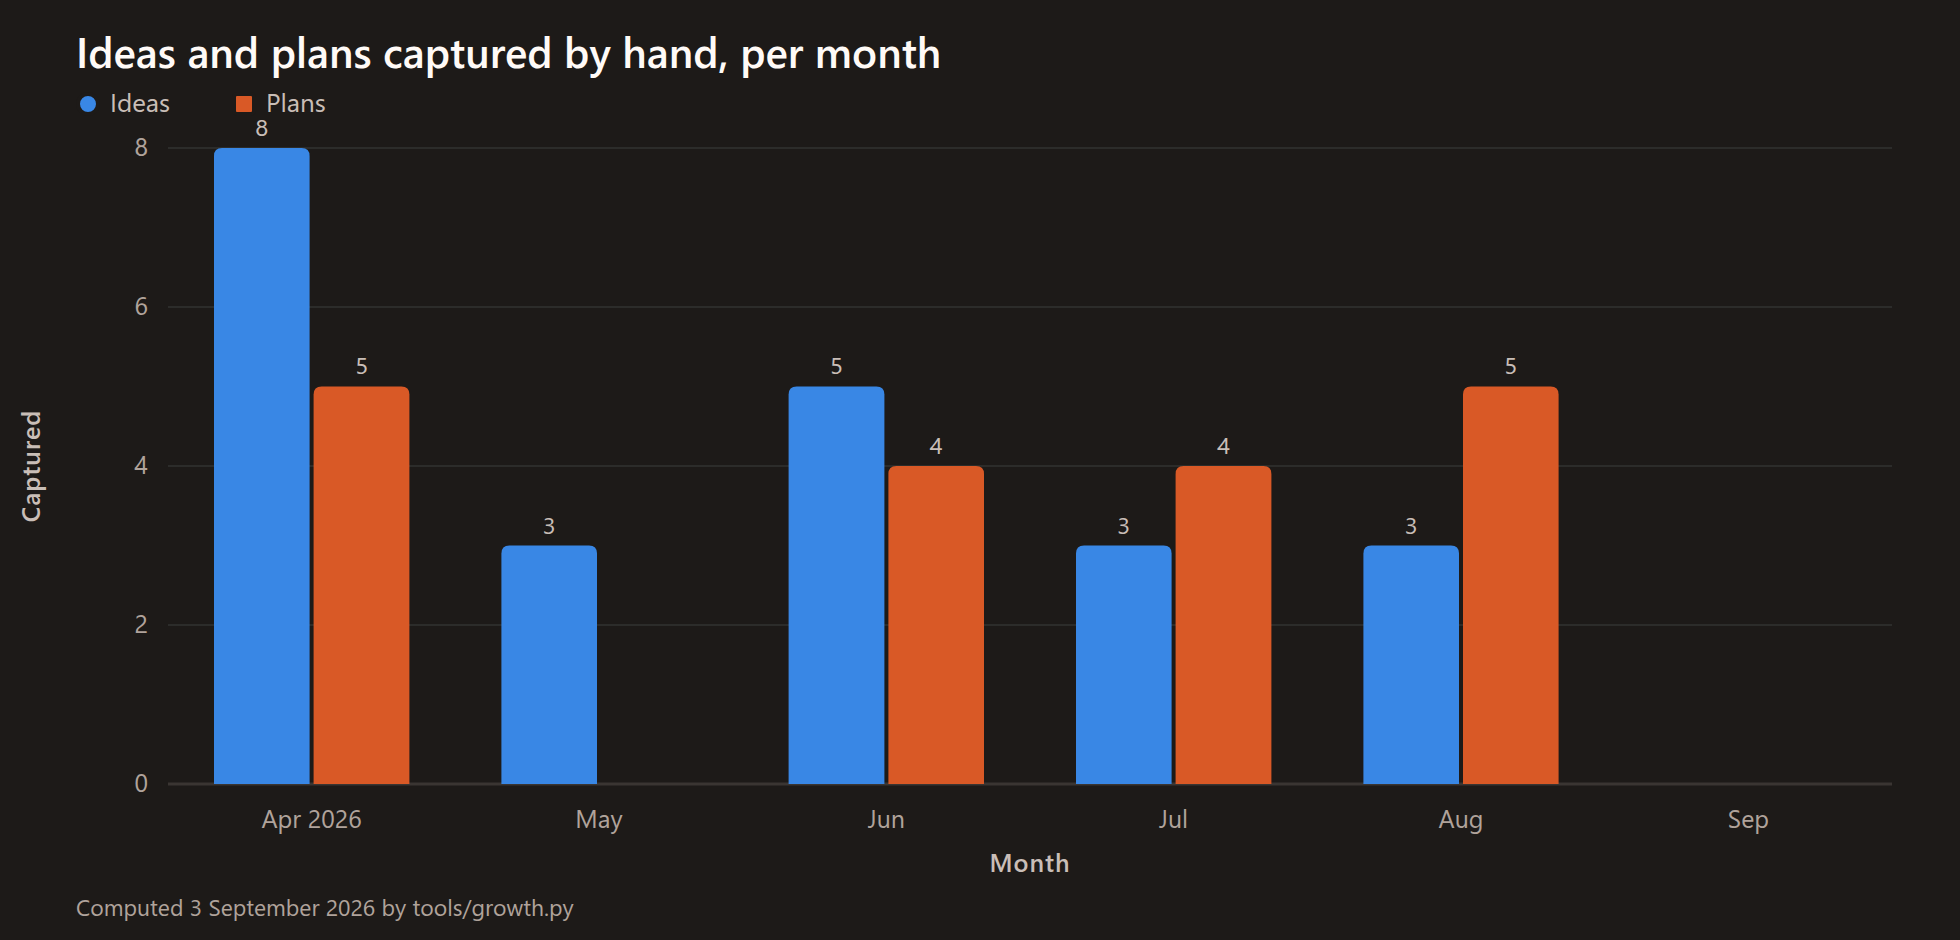
Four months of all of the above, and I have captured 22 ideas and 18 plans. That isn’t a broken counter and it isn’t a failure of the tool — most of what I put into Station arrives as a bookmark, a note, a file, a task or a recorded meeting, and ideas are the specific thing I want argued with. Being able to see that in one picture is worth more than the picture flattering me.
The numbers behind this chart
| Month | Ideas | Plans |
|---|---|---|
| Apr 2026 | 8 | 5 |
| May 2026 | 3 | 0 |
| Jun 2026 | 5 | 4 |
| Jul 2026 | 3 | 4 |
| Aug 2026 | 3 | 5 |
| Sep 2026 | 0 | 0 |
Bookmarks, notes, files, tasks and meetings live elsewhere and aren’t counted here.
How wide it is today
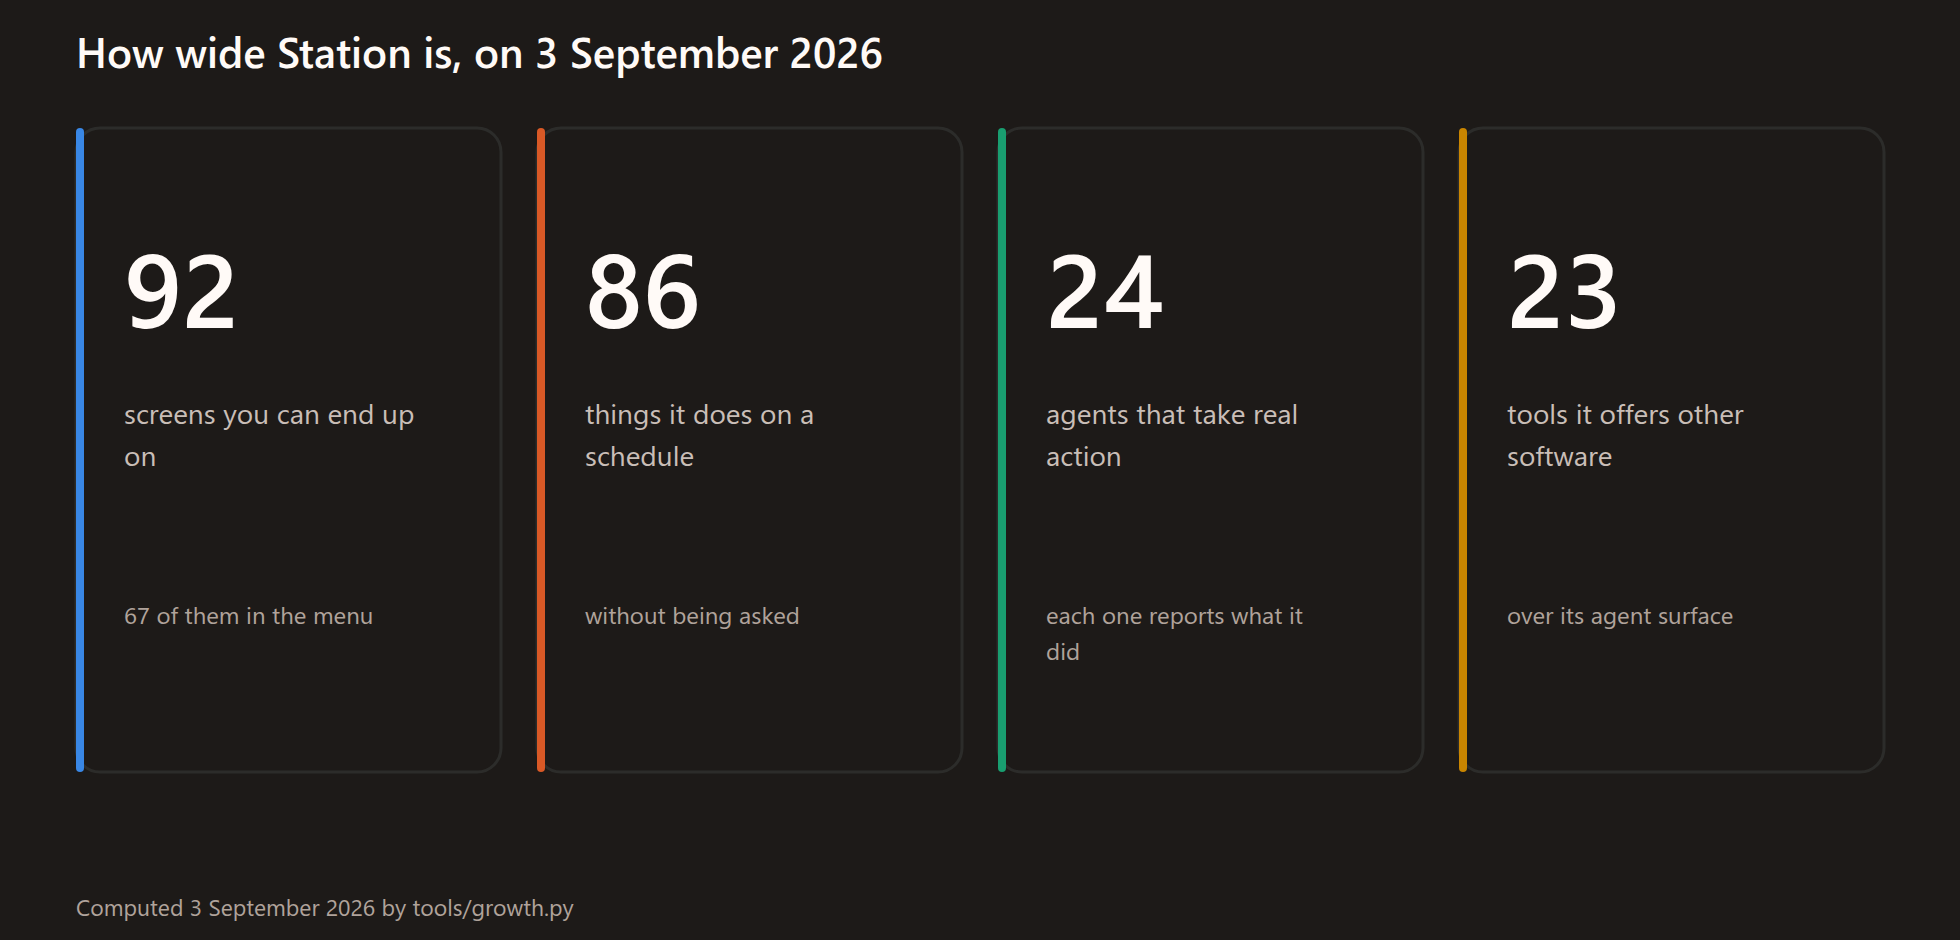
A count of today rather than a trend — there’s no honest way to ask how many screens existed in June without re-running June’s code.
The numbers behind this chart
| What | Count | |
|---|---|---|
| screens you can end up on | 92 | 67 of them in the menu |
| things it does on a schedule | 86 | without being asked |
| agents that take real action | 24 | each one reports what it did |
| tools it offers other software | 23 | over its agent surface |
How these numbers were made
Every chart on this page comes out of one script, run once, on 3 September 2026. It reads the code’s full history for the commits and the line counts, the change tracker for the proposals, each written decision for its own date, the running record for its entries, the storage-change files for theirs, the code itself for how many screens, jobs, agents and tools exist today — and Station’s production database, read-only, for what it holds.
It writes each chart twice: a picture, and the table of numbers underneath it. That means two things. Nothing on this page is a figure I remembered and typed in. And when I refresh this page next quarter, the charts and the sentences under them will disagree with each other loudly if I’ve let one go stale.
Three things worth saying out loud about the counting, because charts are very good at lying quietly:
- Commits are counted on the main line of the code only. A working copy also carries every unfinished branch, and counting those would credit the same work twice.
- The line counts are the application only. Tests, storage changes and documentation are excluded, which makes the numbers smaller and more honest.
- September is a part month everywhere. It stops on 3 September 2026, so every final bar is short by design.
What all this grew into, screen by screen: the grand tour →. The strangest part of it: Station builds itself →.